Marin County Real Estate - October 2020 Report
October 6, 2020
Source: Compass
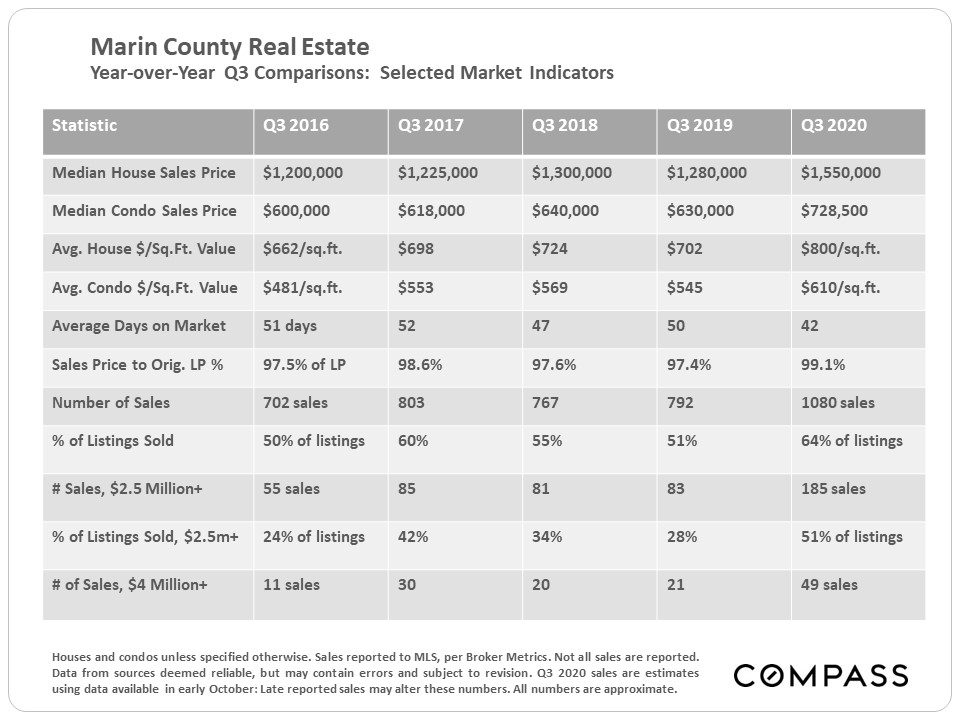
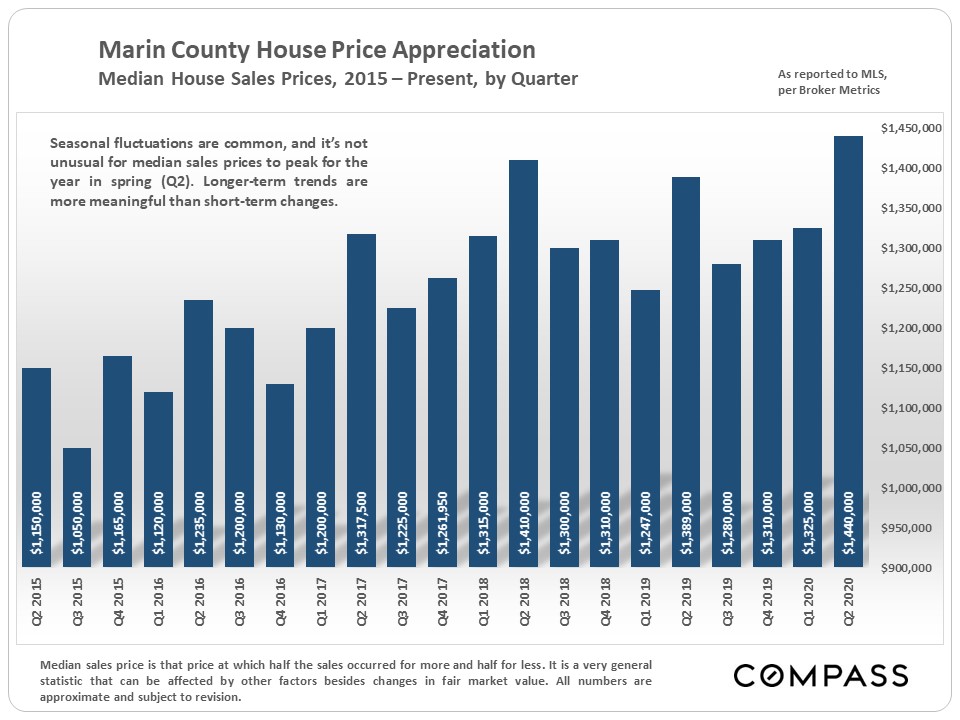
The table below compares Q3 statistics across 5 years. The huge jump in the median house sales price will be discussed further later in the report. |
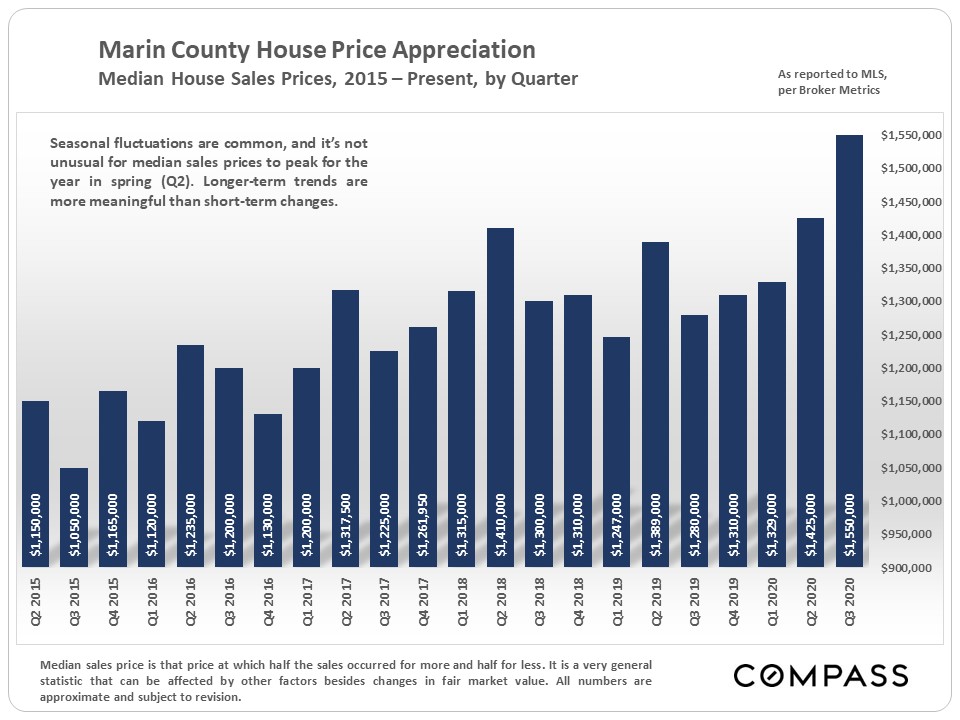
Median House Sales Price by Quarter |
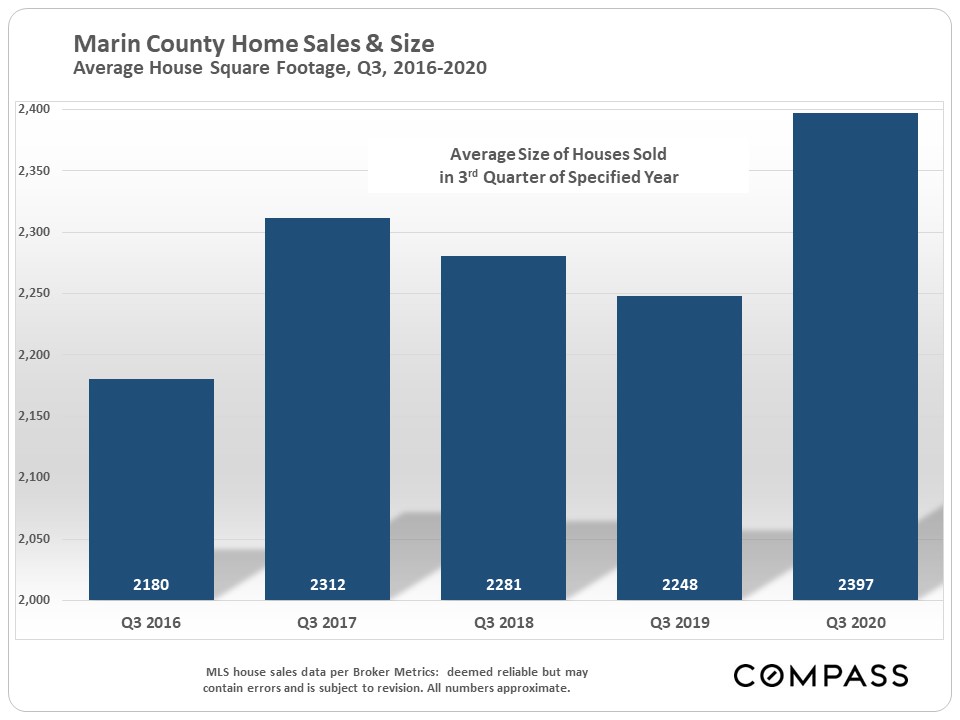
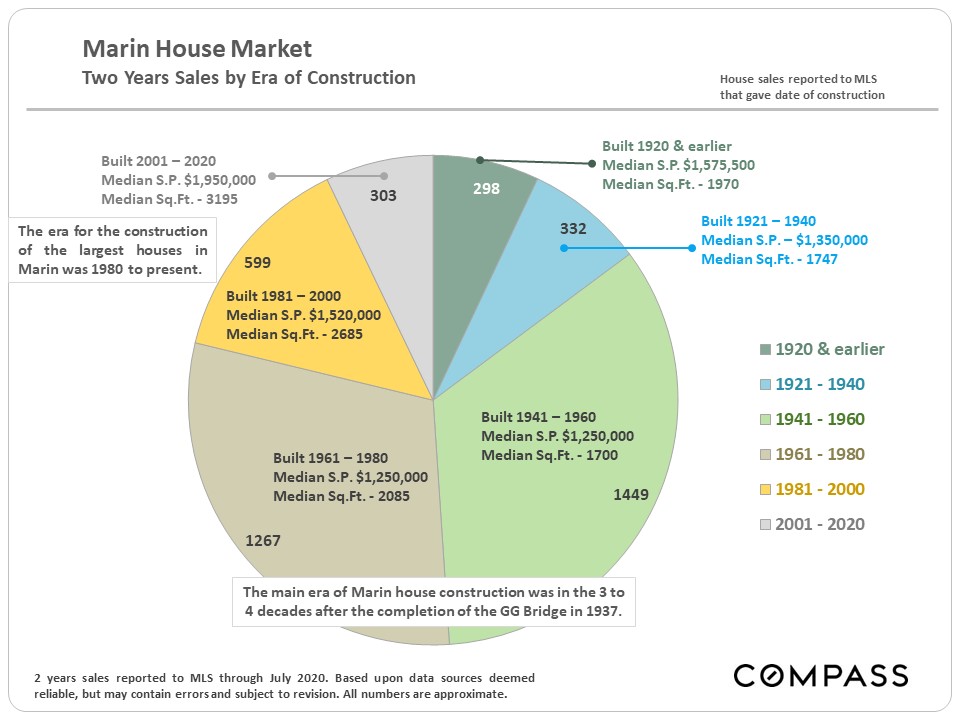
Median sales prices can rise because of increases in fair market value – i.e. buyers are paying more money for the same home (supply and demand) – and/or because buyers are purchasing larger, more expensive houses, often in more expensive communities. Both dynamics are currently at play, but it is certain that affluent and very affluent buyers have made up a dramatically increasing percentage of the demand in Marin and Bay Area markets. This next chart illustrates the large year-over-year increase in the average size of houses sold. |
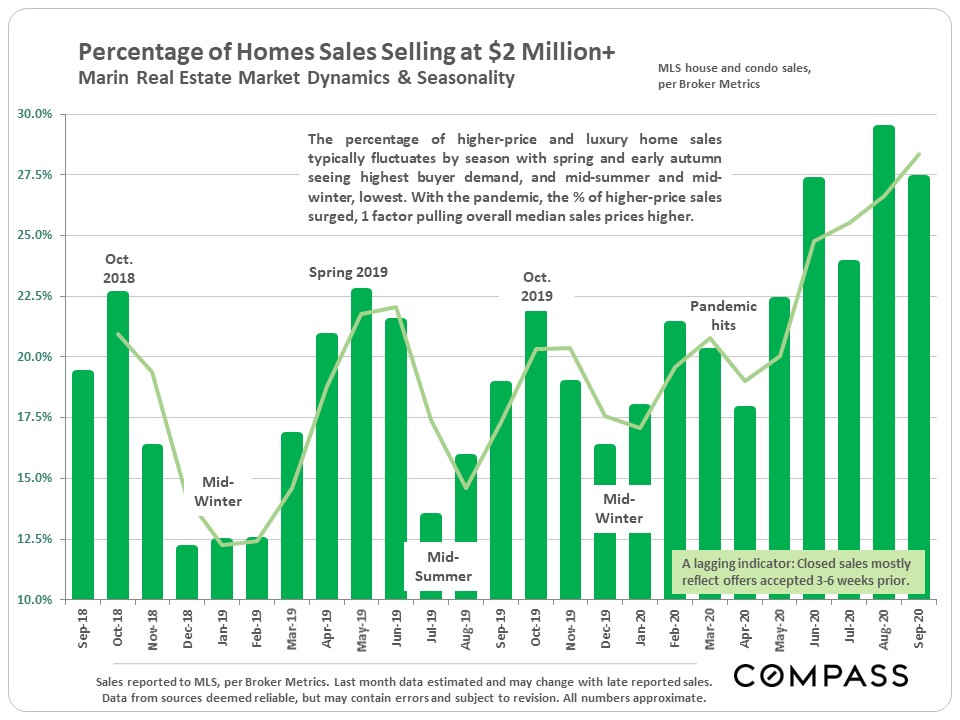
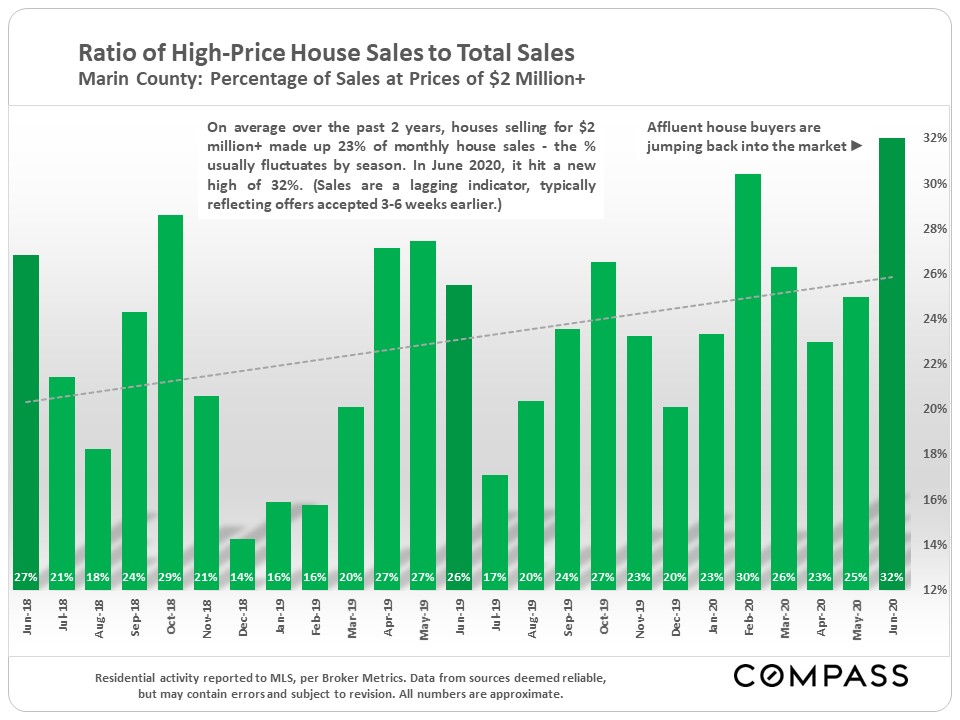
And this chart graphs the increasing percentage of higher-price home sales in recent months. |
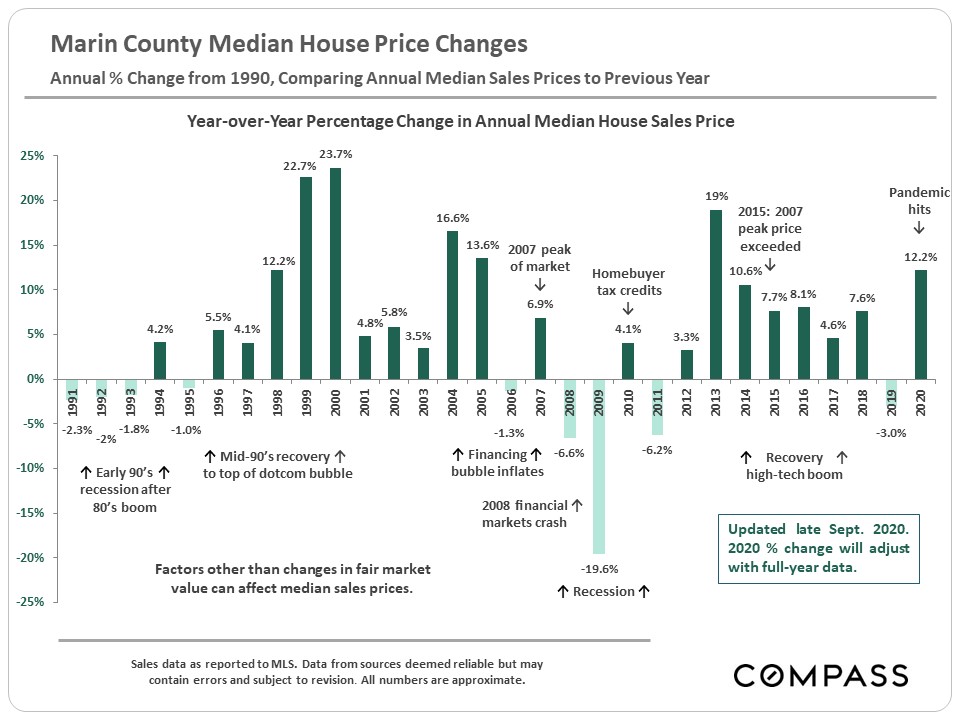
Annual percentage changes in median house sales price: The 2020 YTD percentage will almost certainly change, one way or another, by the time full-year sales data is in. |
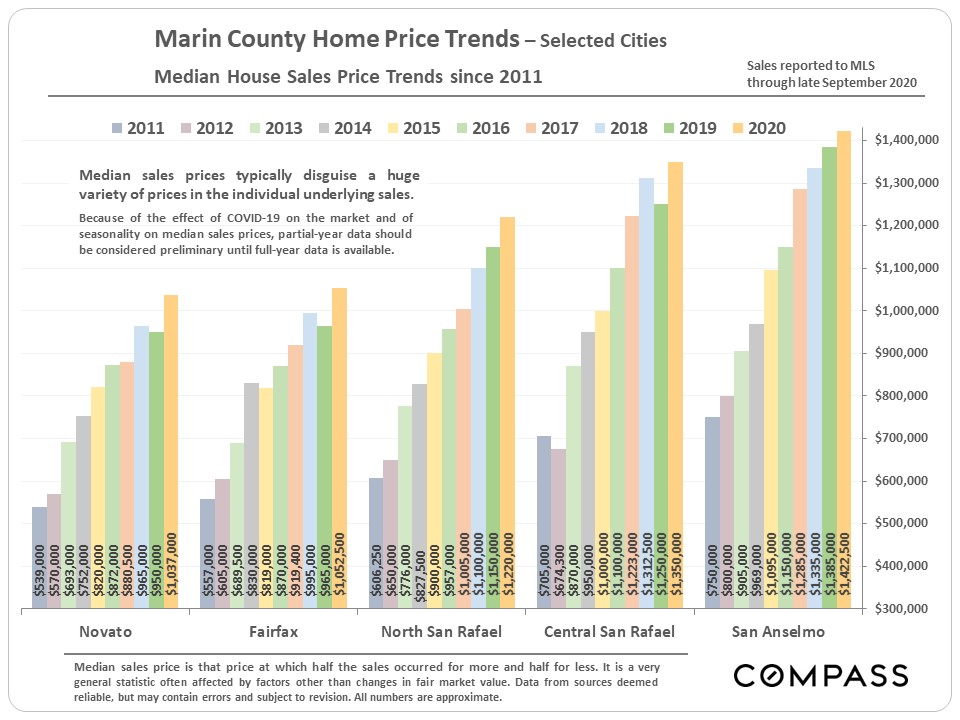
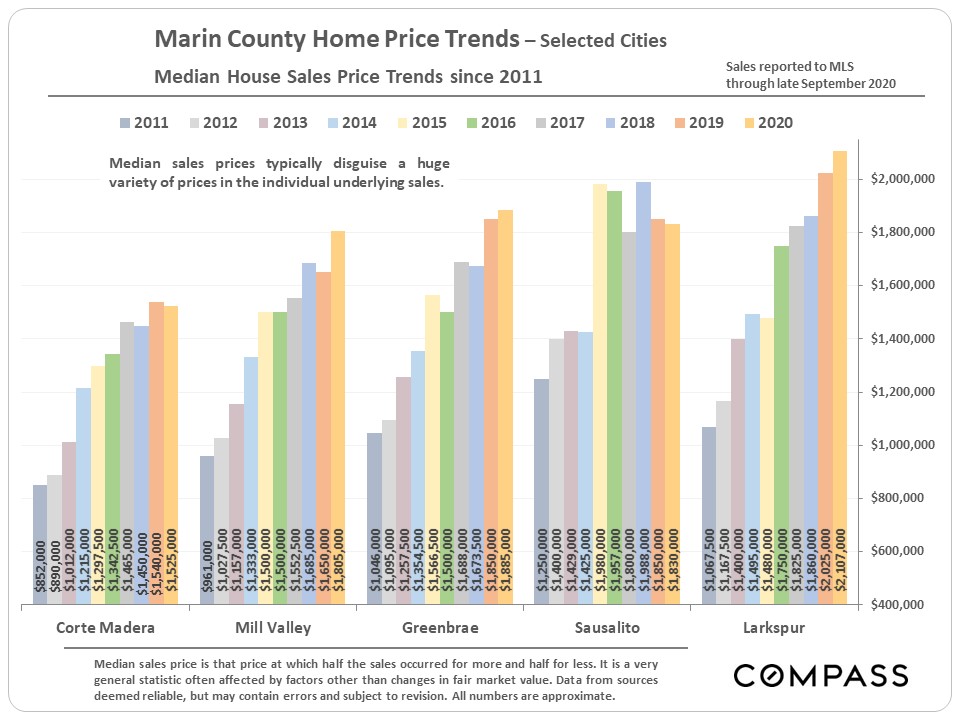
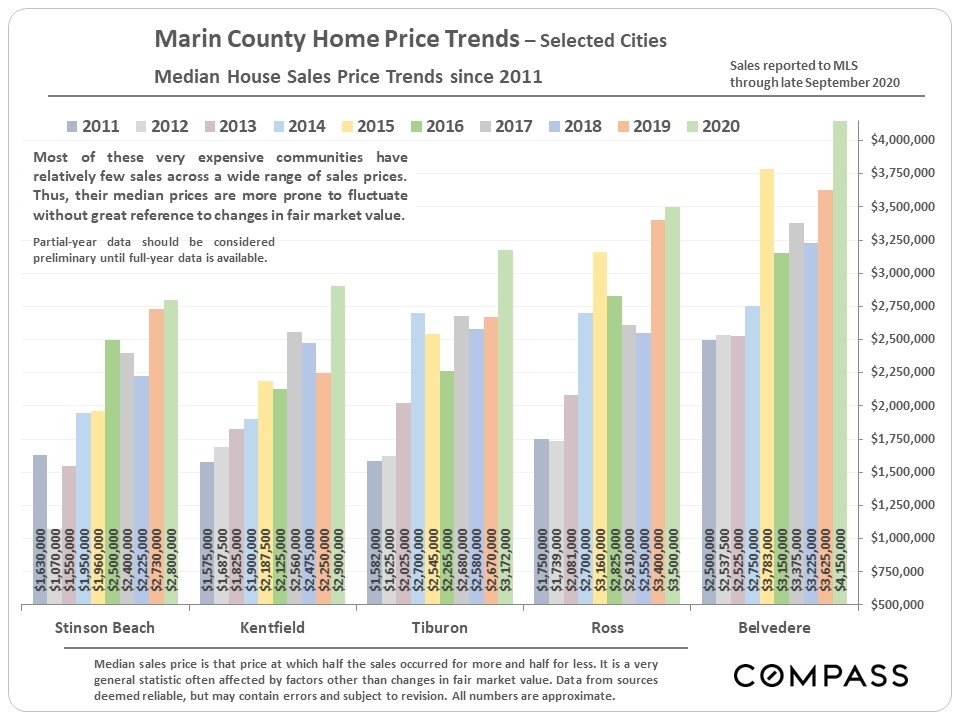
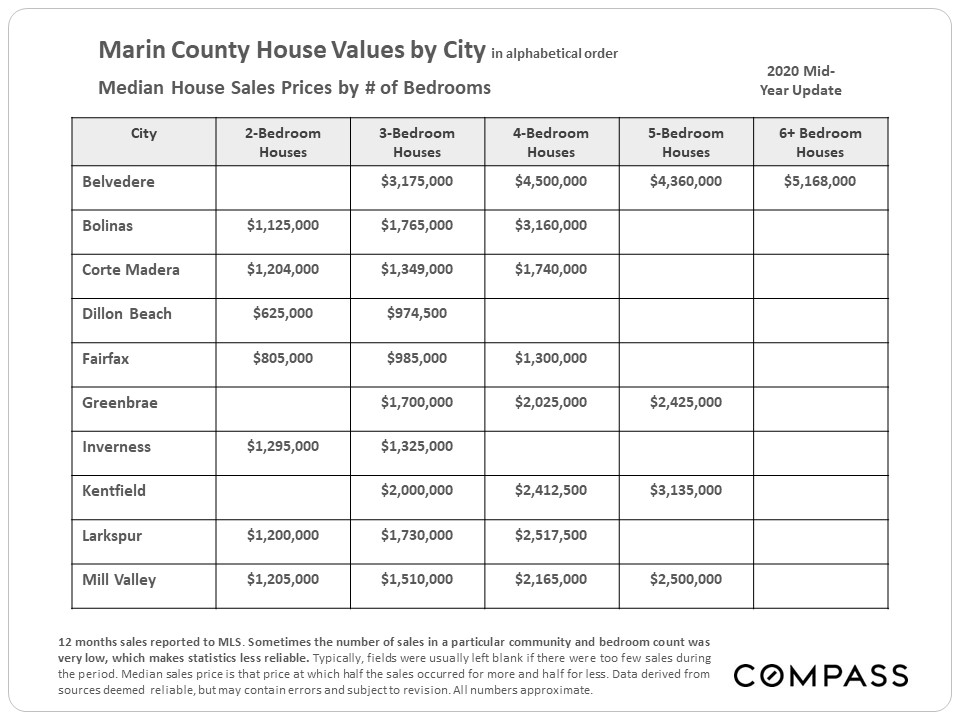
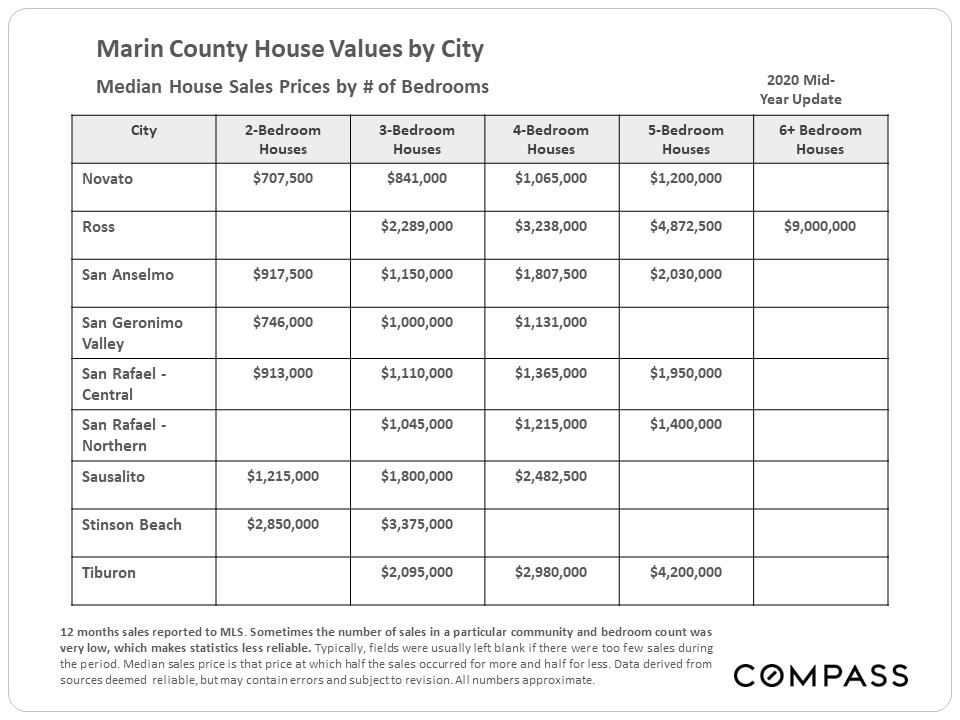
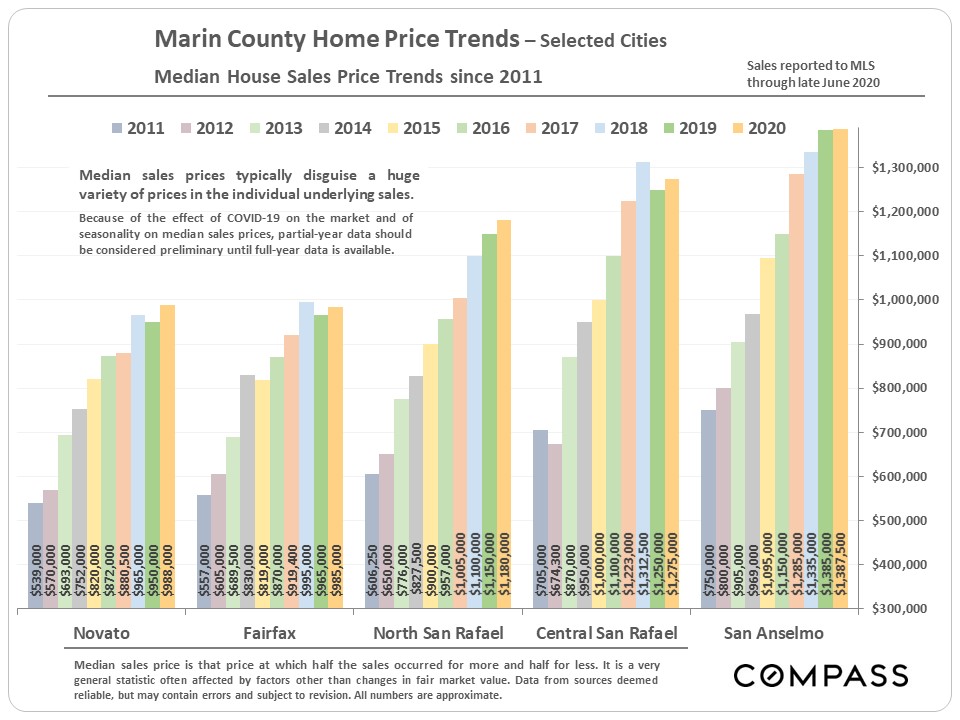
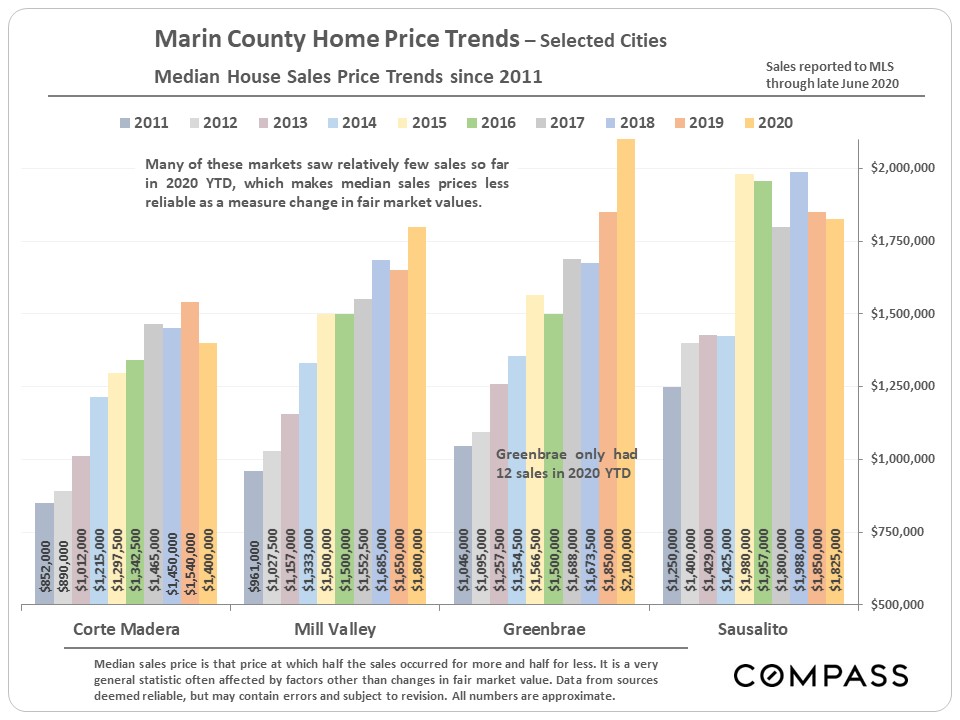
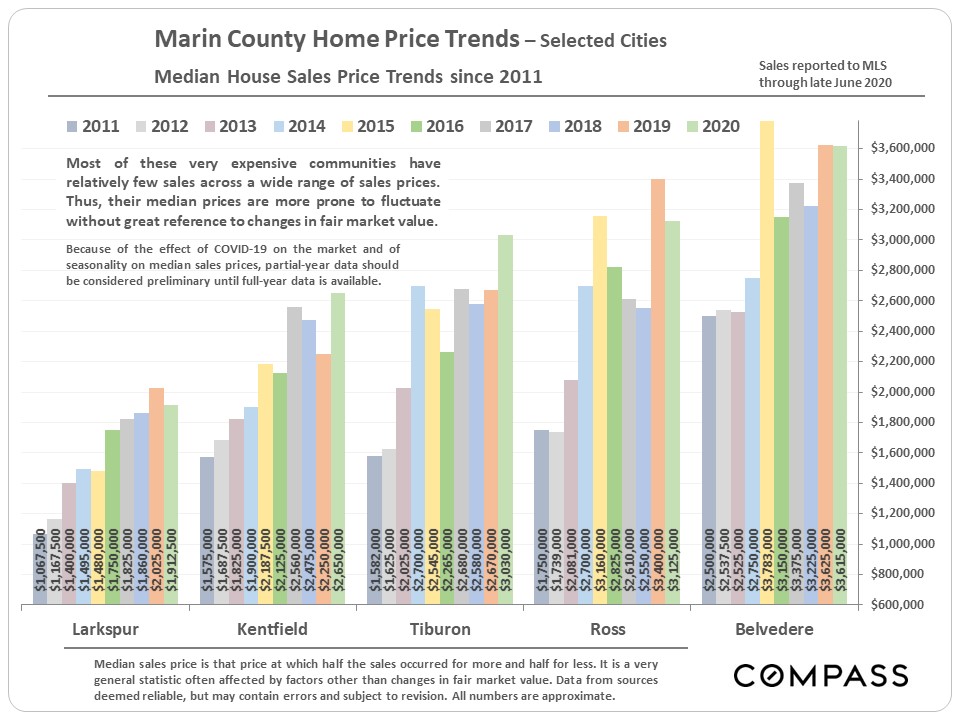
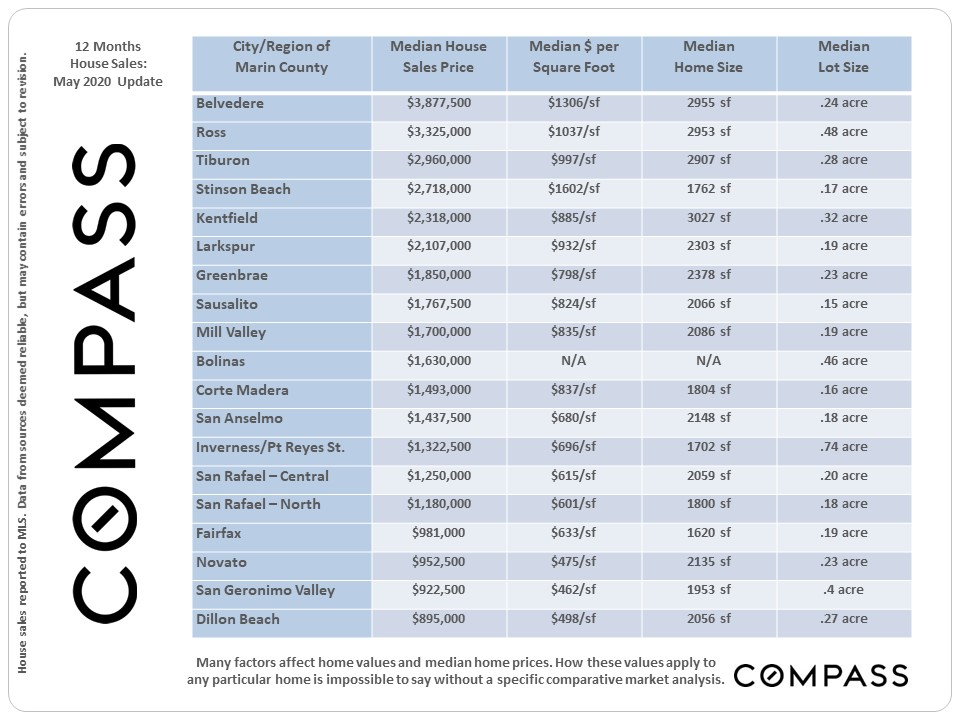
Median House Sales Price Trends by City |
Selected Supply & Demand Indicators |
|
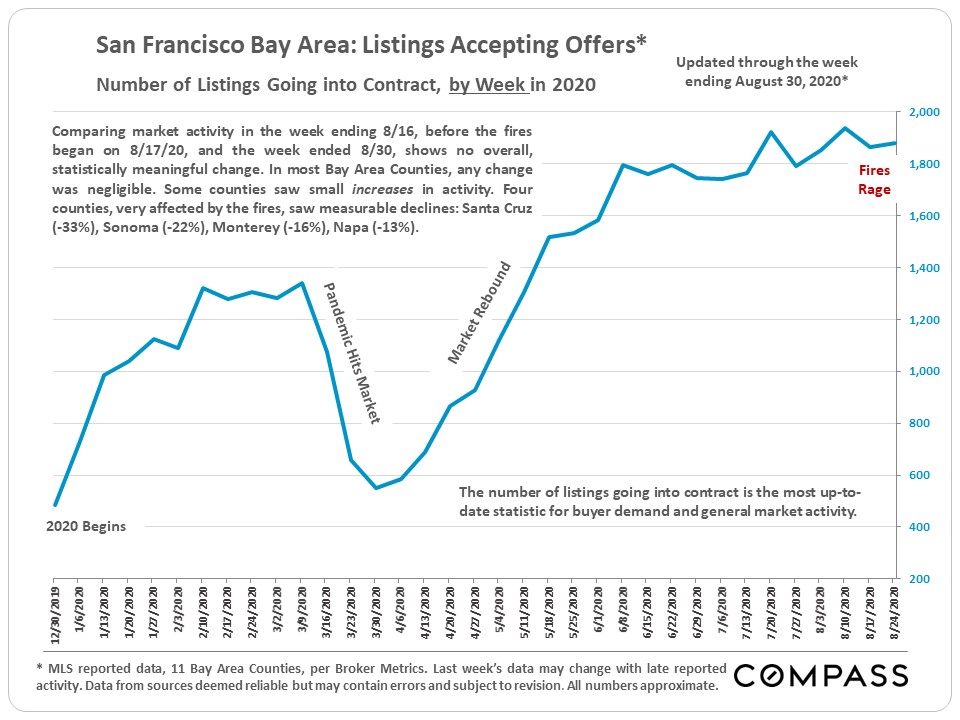
Very surprisingly, the terrible fires did not significantly impact the number of deals being made in most Bay Area counties during the last 2 weeks of August - the exceptions being Santa Cruz, Sonoma, Monterey and Napa Counties, which saw declines of 13% to 33%. Marin's numbers didn't really change at all in the second half of the month. (This chart looks at week by week activity in the Bay Area.) |
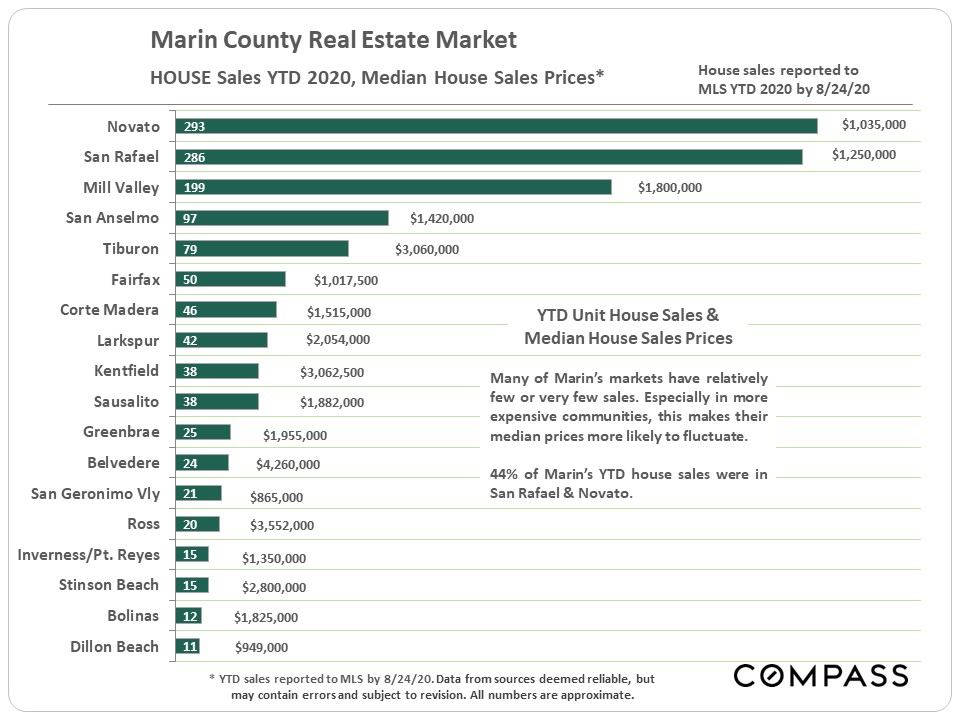
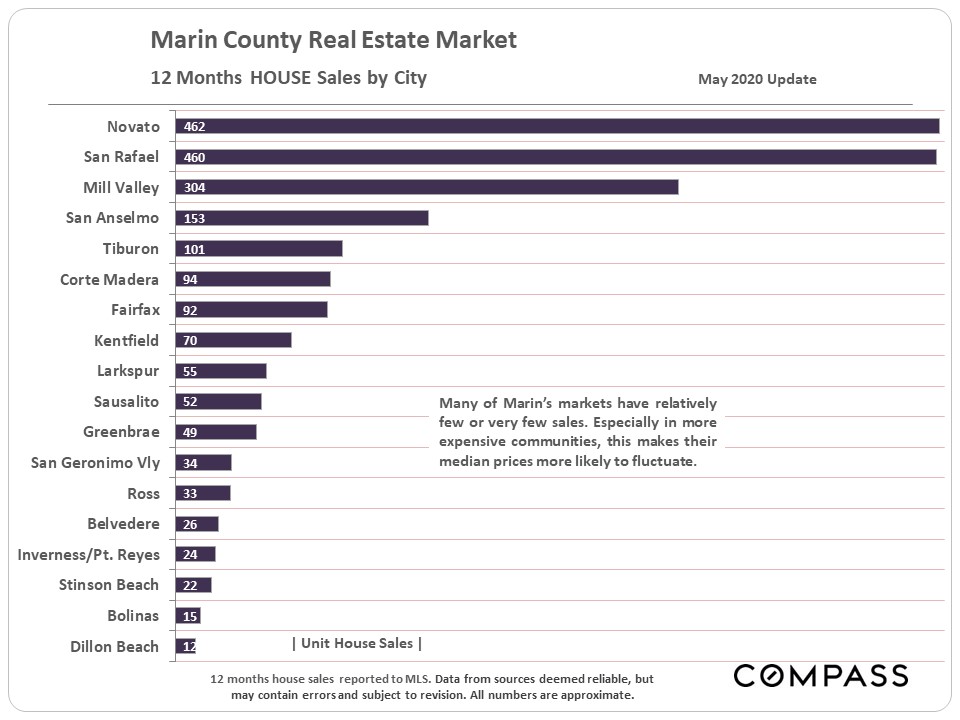
Year-to-date, house sales and median house sales prices by city: As can be seen, Novato and San Rafael dominate in terms of sales volume. |
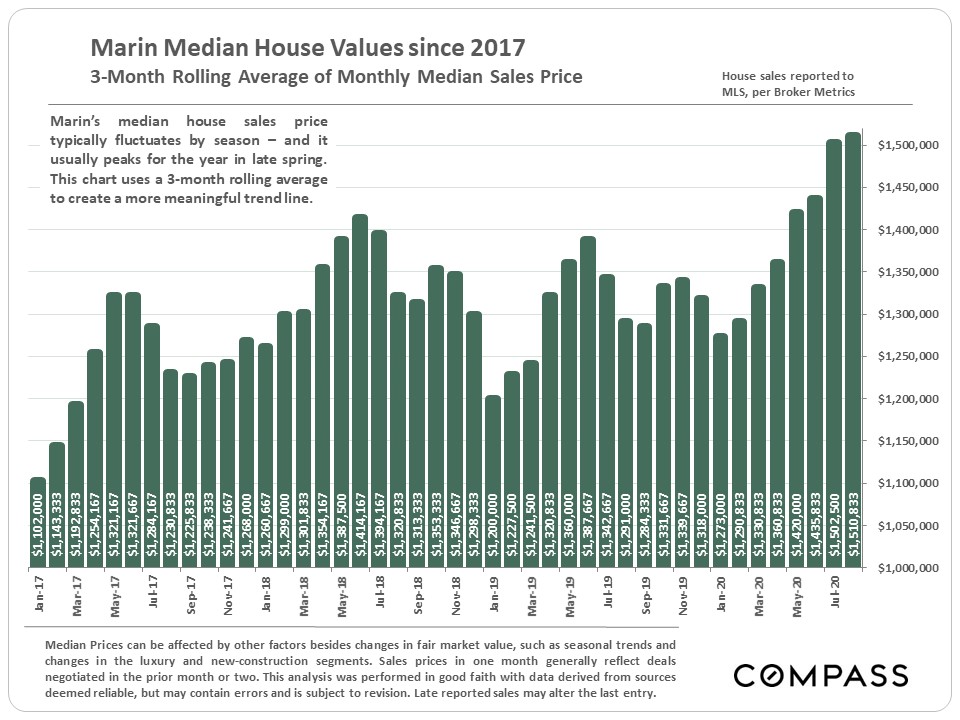
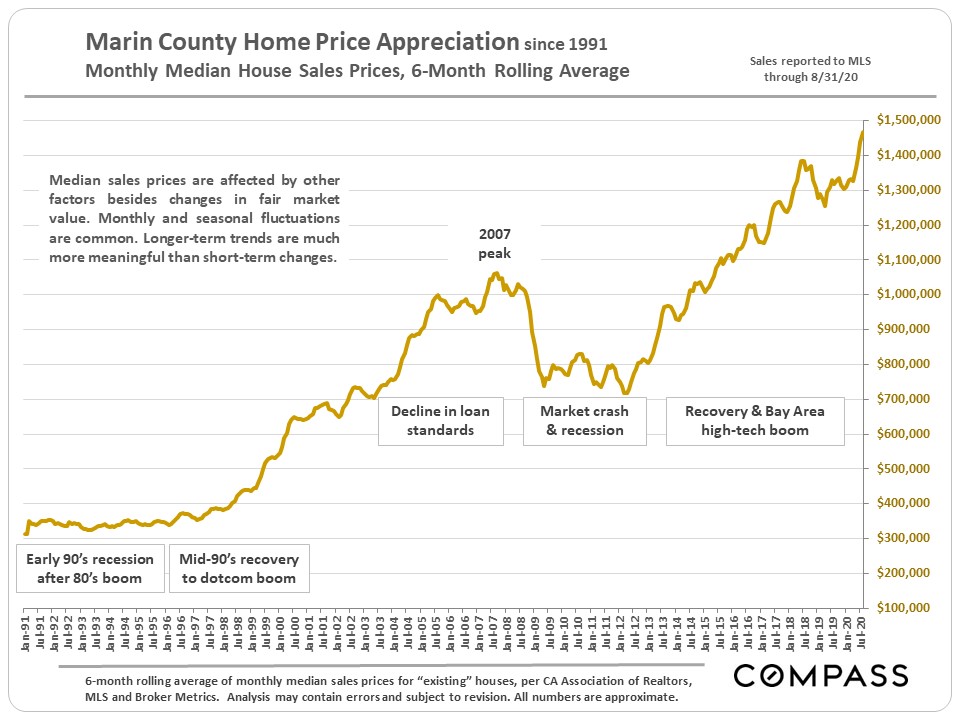
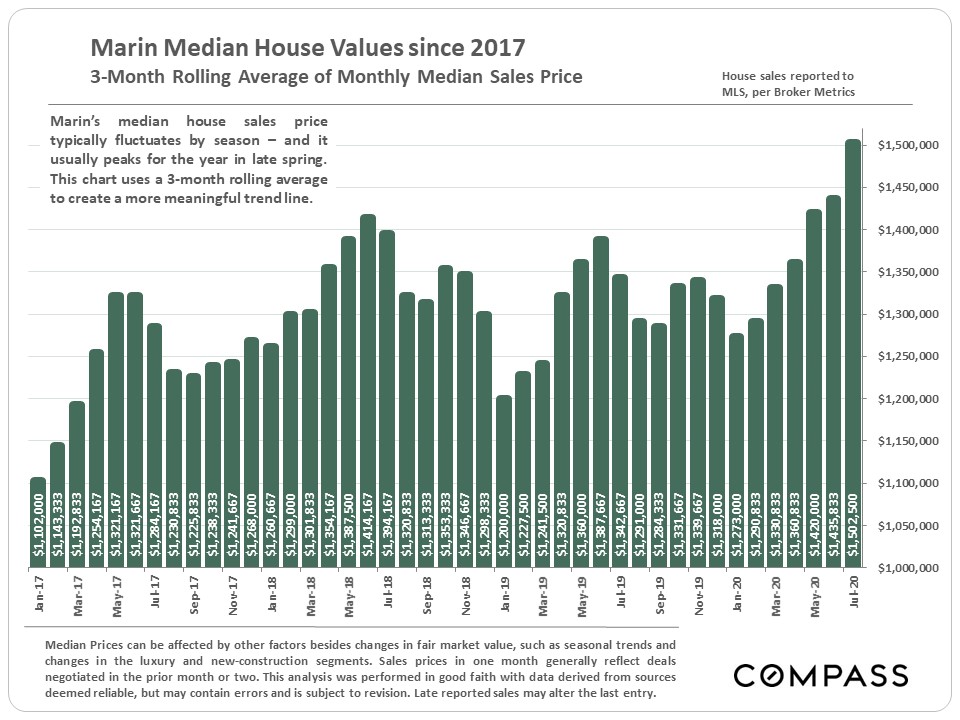
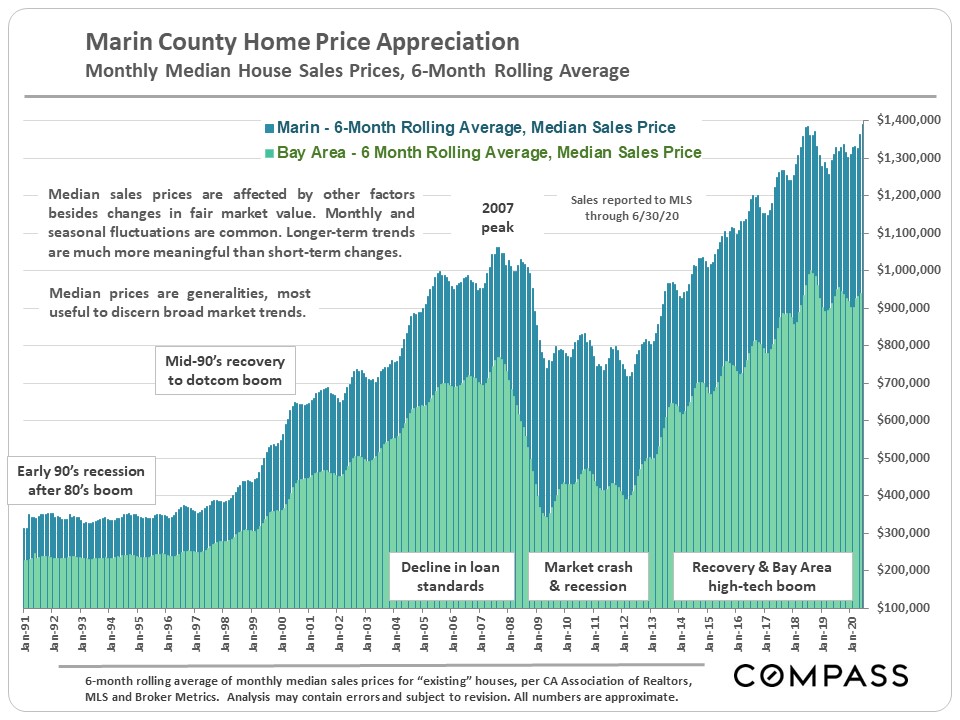
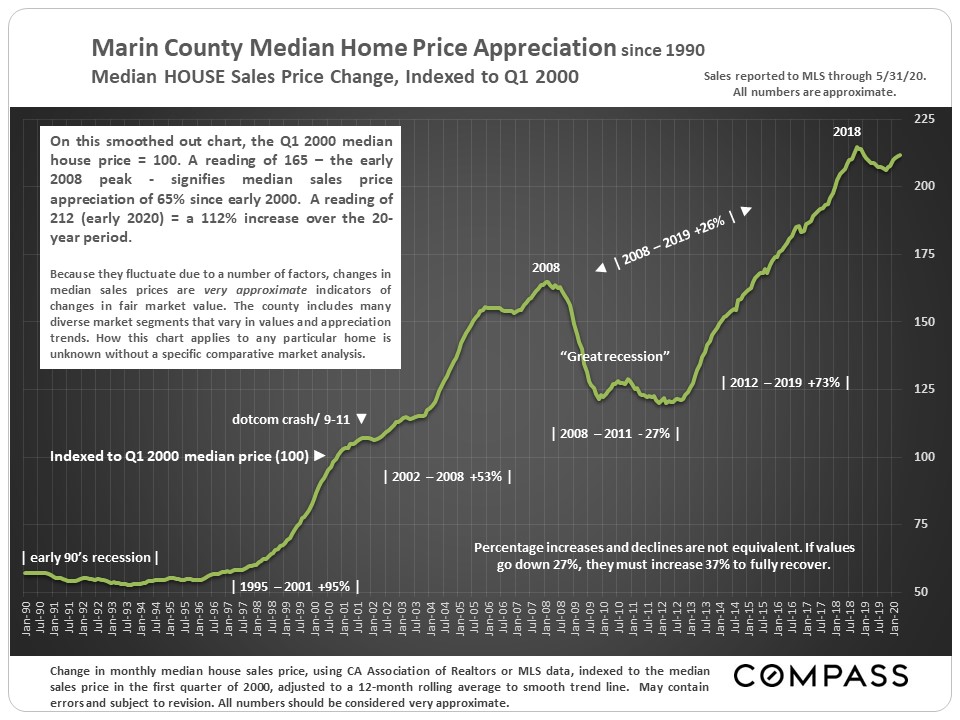
2 charts - shorter-term and longer-term - regarding the Marin median house sales price. |
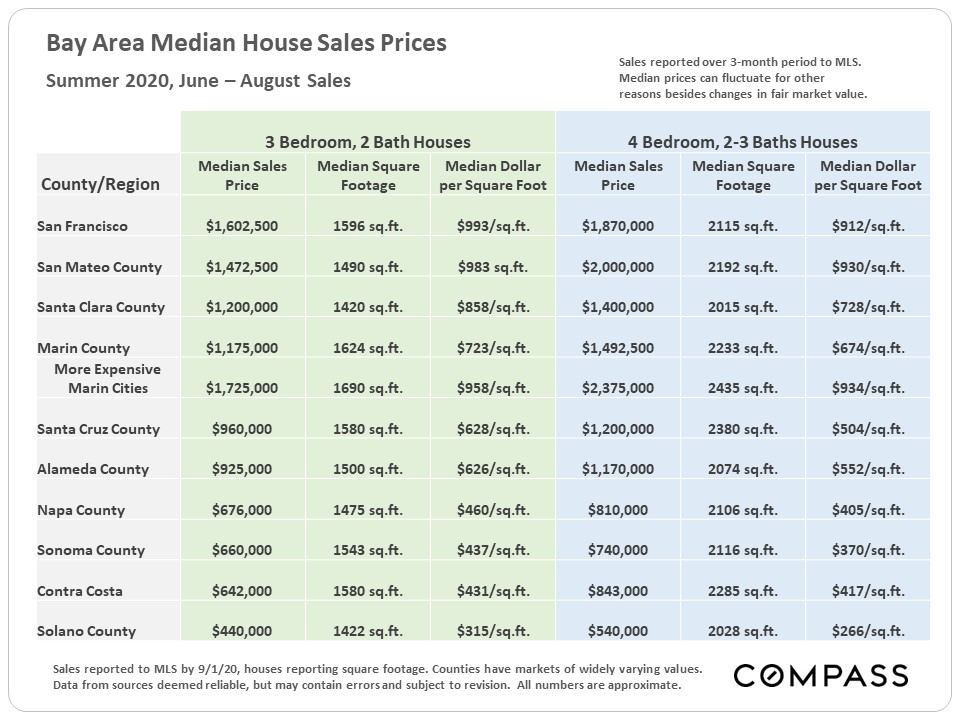
Bay Area median house sales prices, summer 2020. We've also broken out the more expensive county markets - generally located in central and southern Marin. |
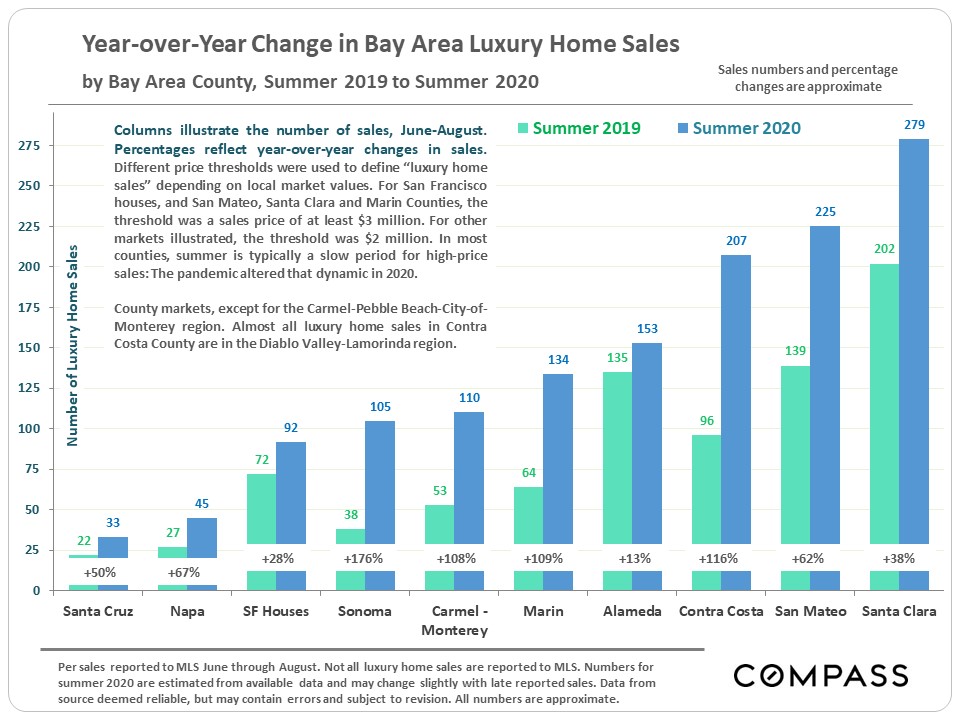
Bay Area luxury home markets: Year-over-year, summer sales volumes and percentage changes. Marin County saw its luxury sales more than double over summer 2019. As compared to its population count, Marin has a very large and dynamic luxury home segment. |
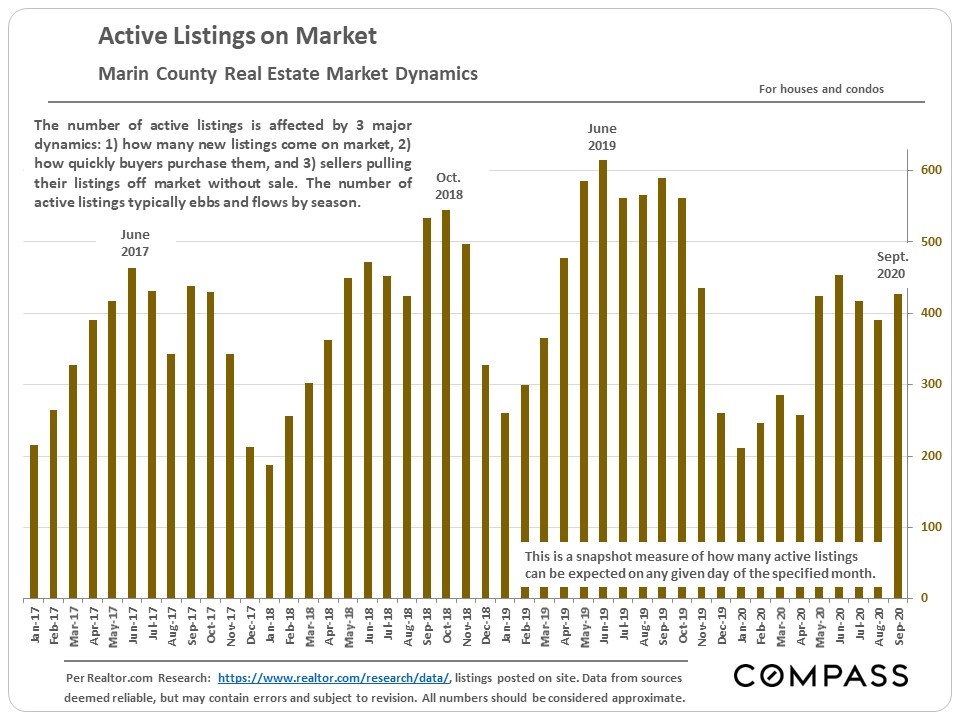
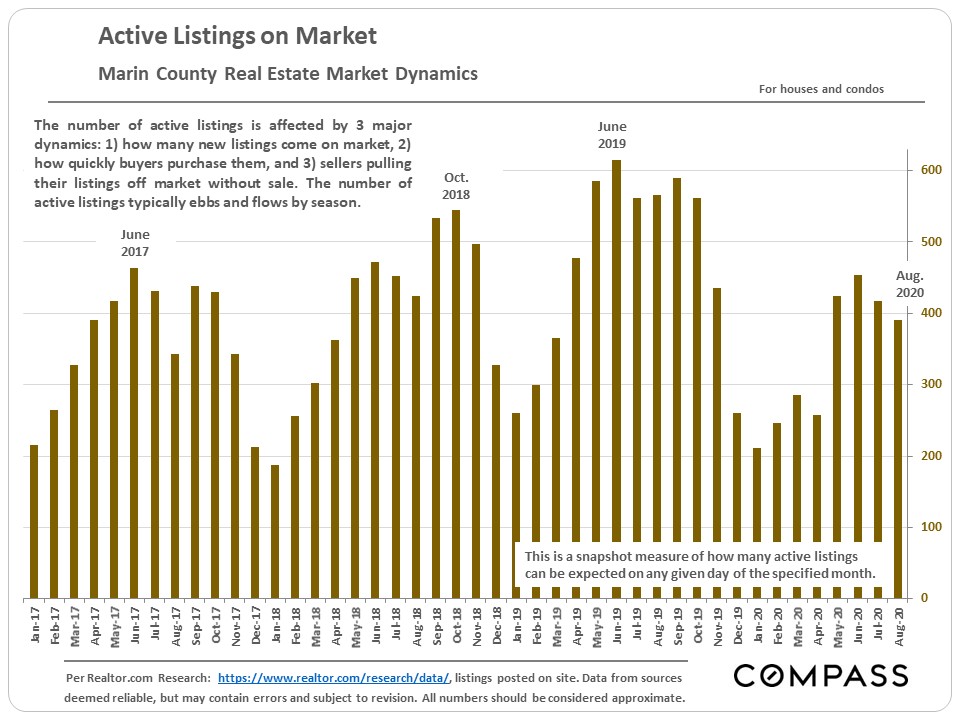
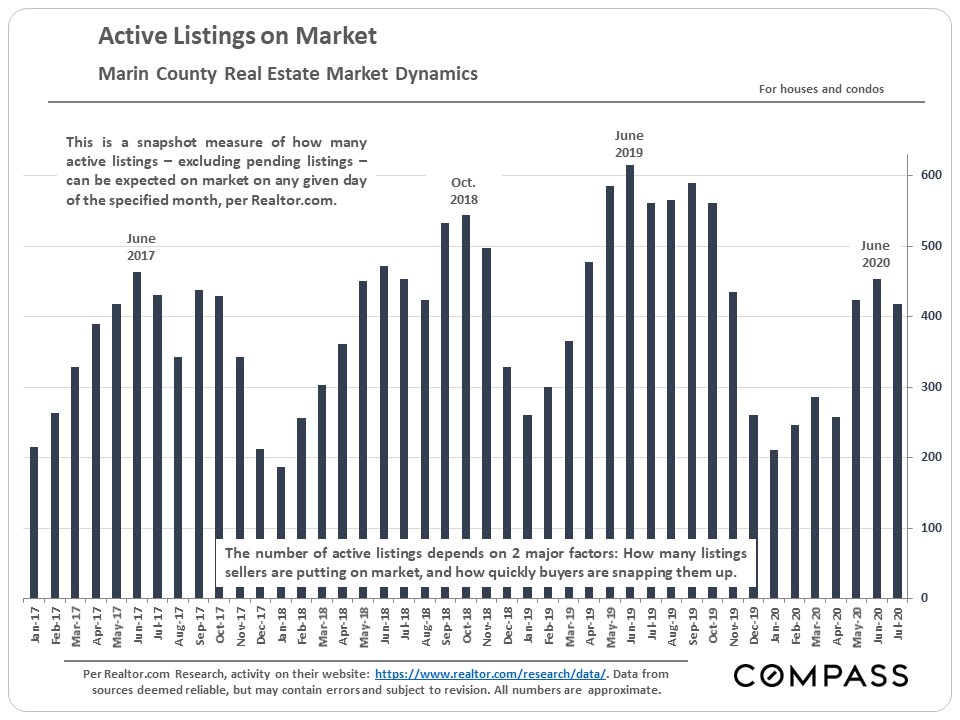
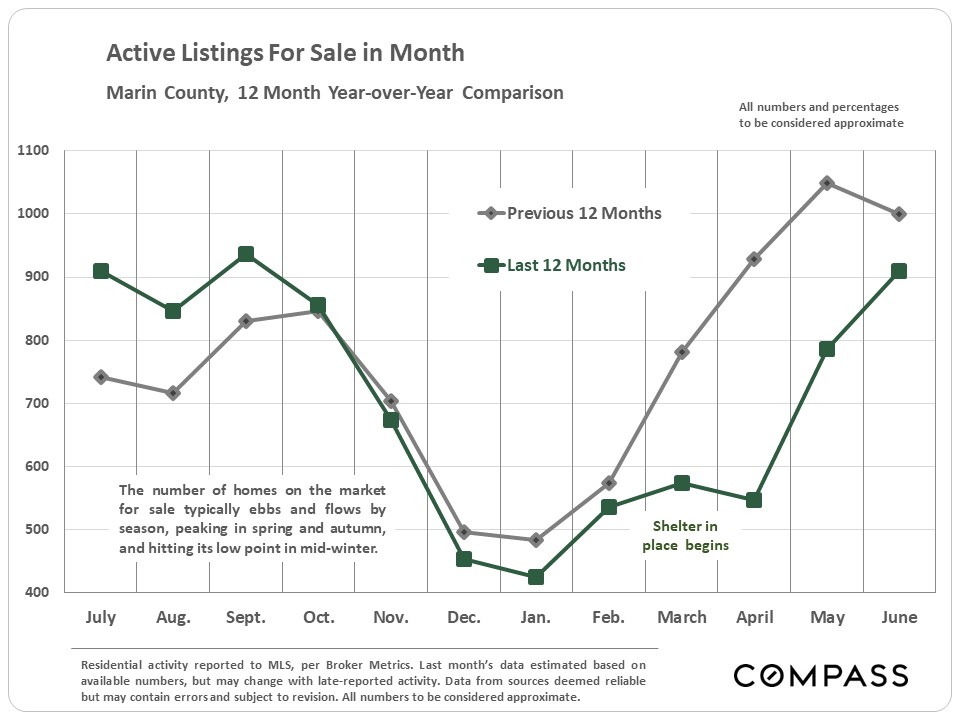
A snapshot measure of how many listings were typically active on any given day of the specified month: Marin's inventory of listings is running quite low, putting additional pressure on the market. |
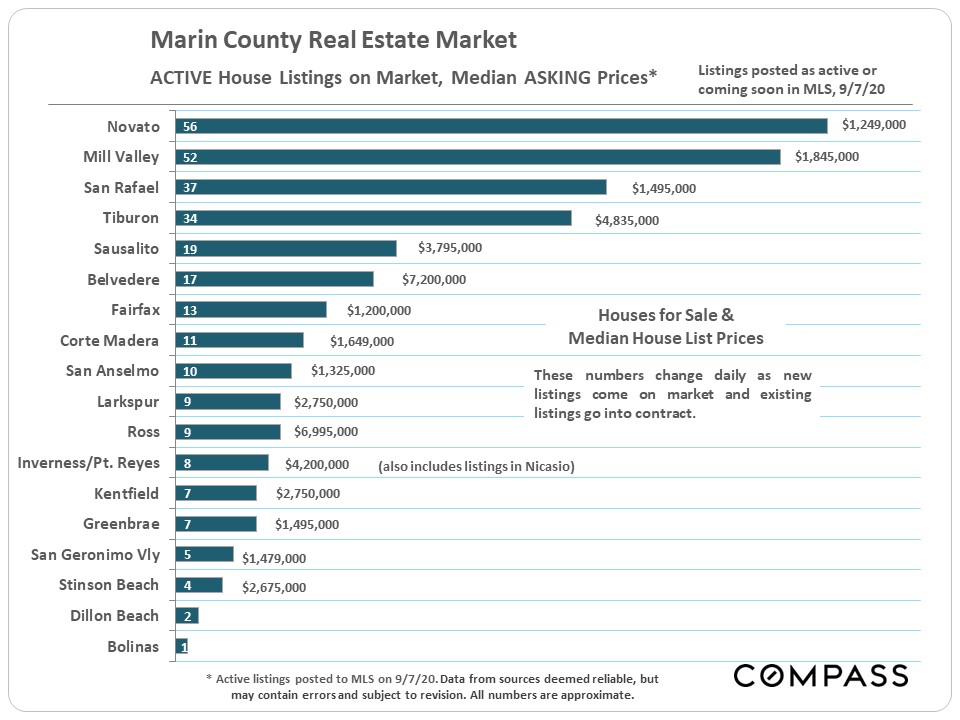
Active house listings and median house listing price by city as of September 7th. These numbers change daily, as new listings come on market and existing listings go into contract. |
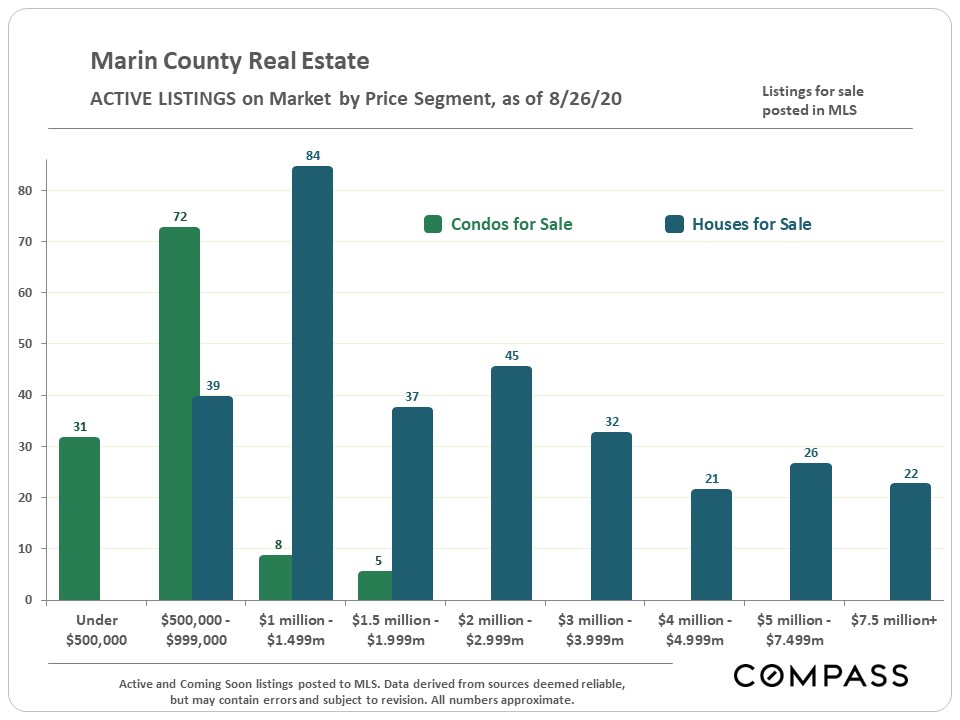
Active listings on the market in late August by price segment and property type. These numbers change daily. |
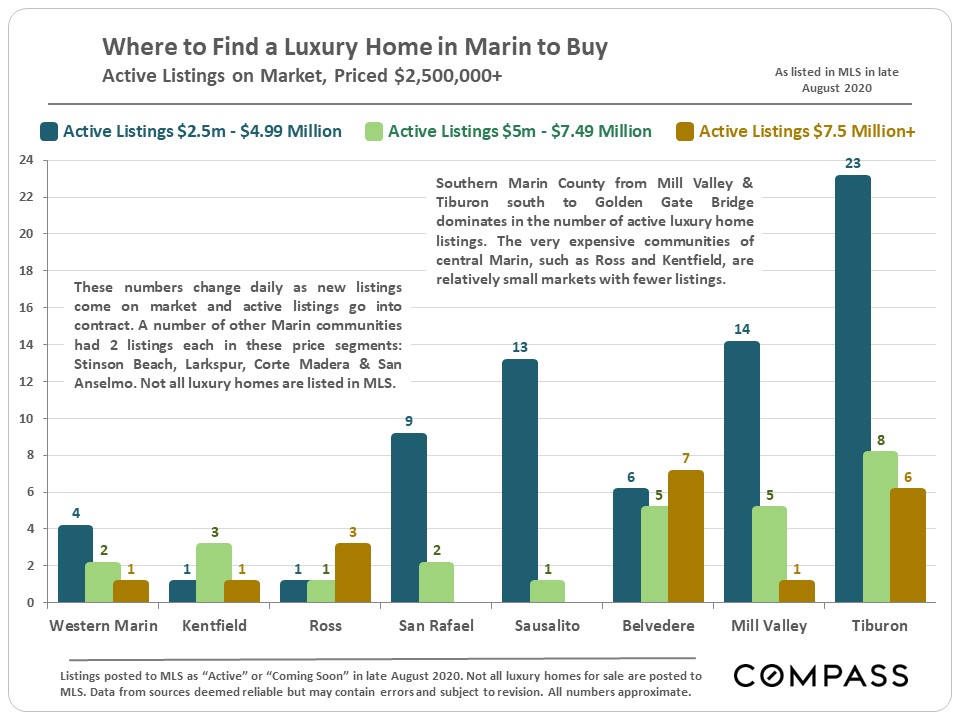
Active luxury home listing on market in late August by city. These numbers change daily. |
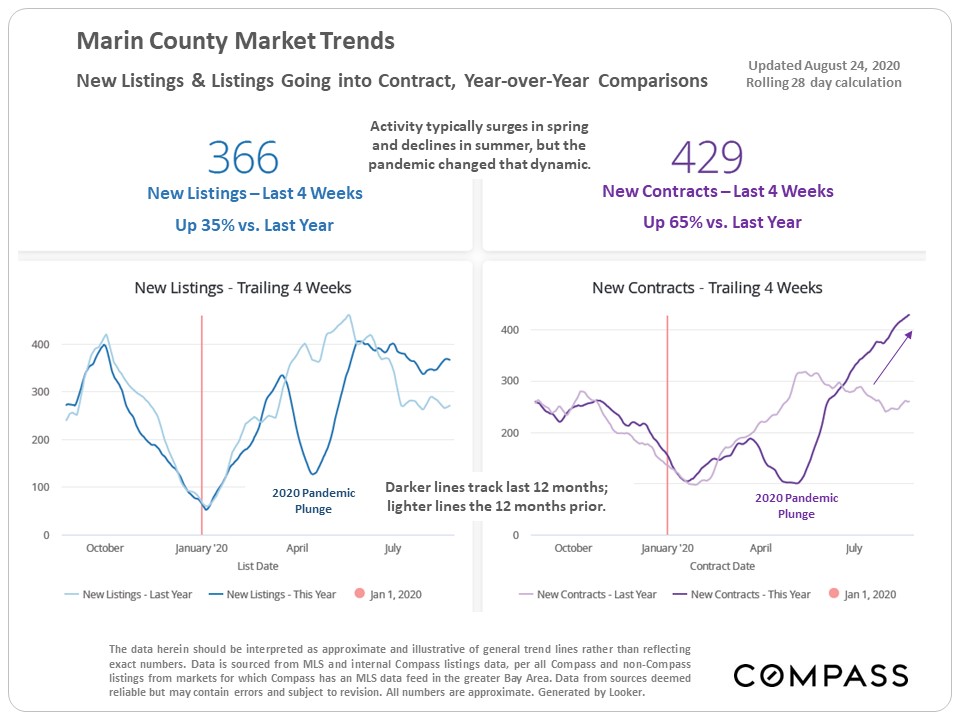
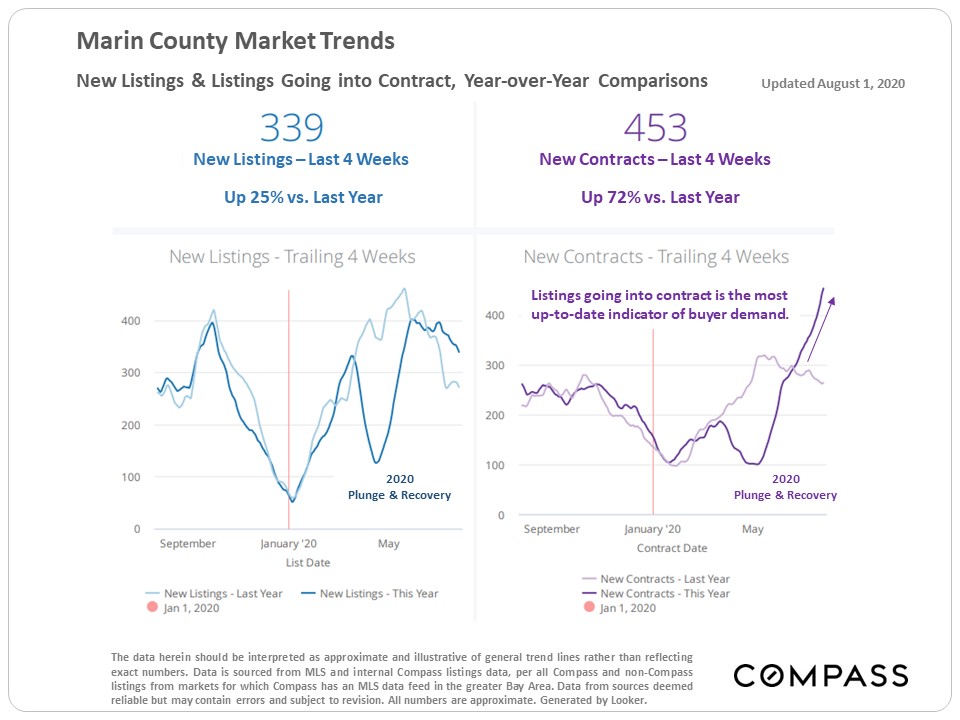
Year-over-year market indicators: New listings are up 35% vs. the number of listings going into contract up 65%. Buyers are snapping up listings faster than sellers are putting their homes on the market. |
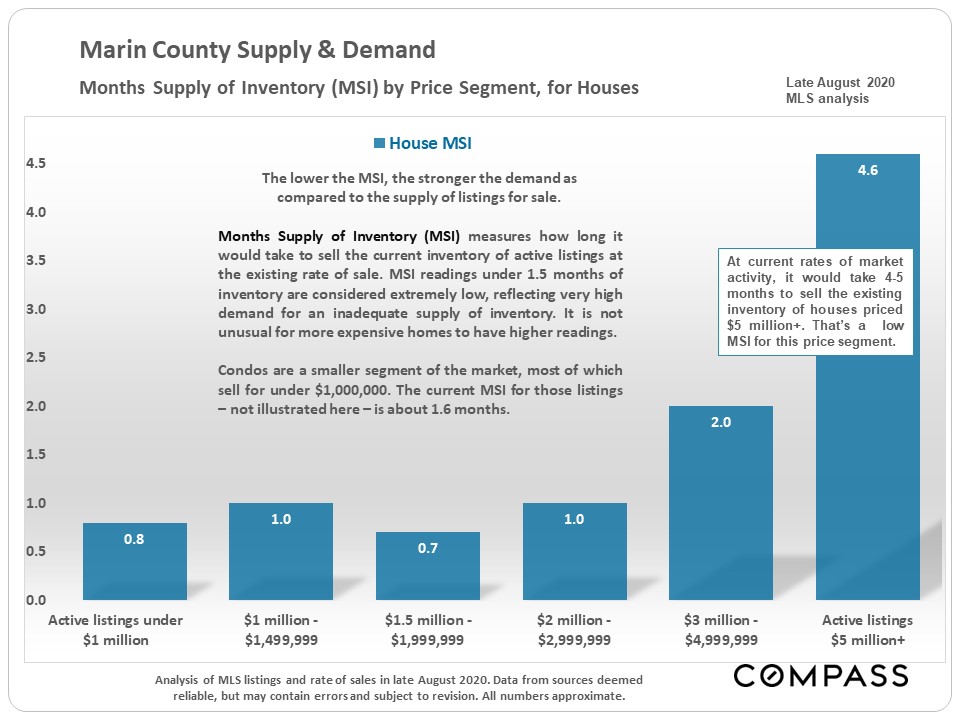
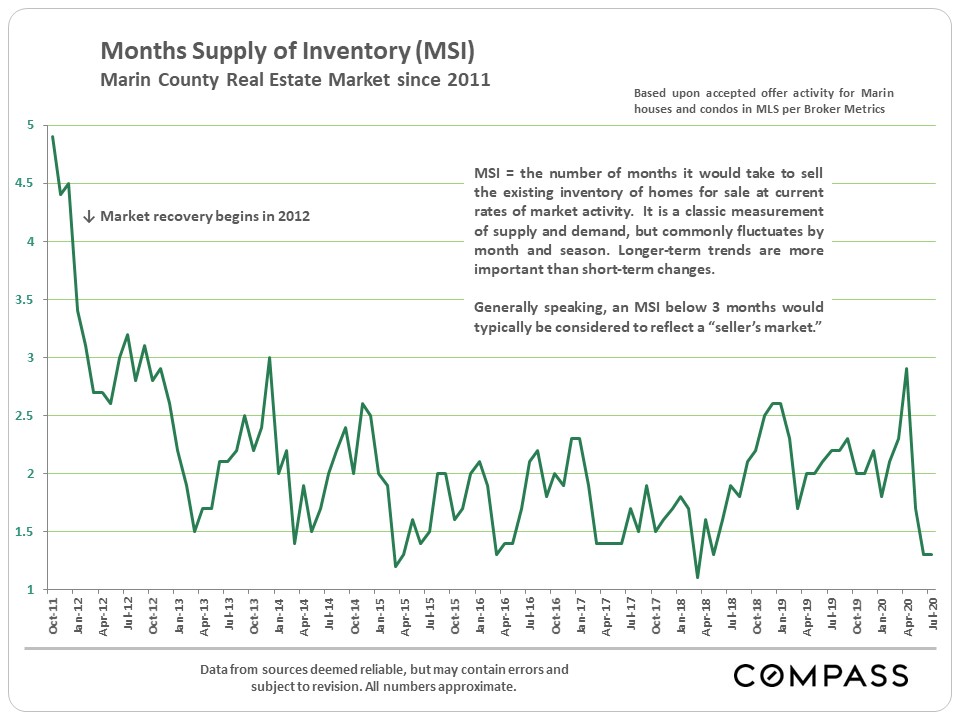
The lower the Months Supply of Inventory (MSI),the stronger the demand as compared to the supply of listings. Most of the Marin market remains very deep in "seller's market" territory by this measure. |
|
Marin County Real Estate Report |
Median house sales price hits new high; year-over-year total listing inventory down; sales activity way up; luxury home sales soar |
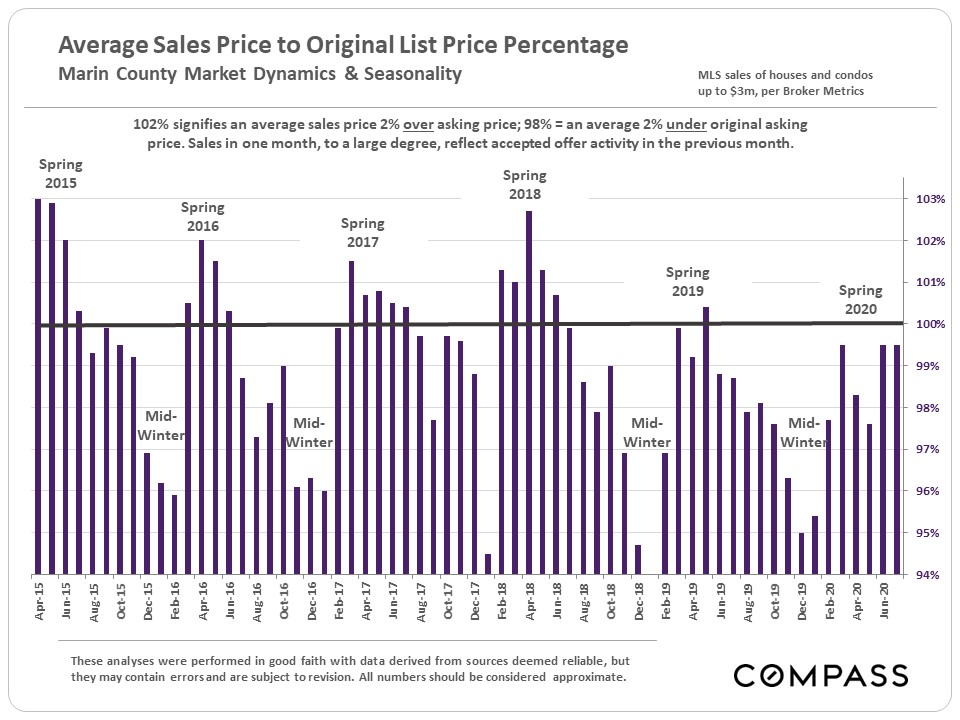
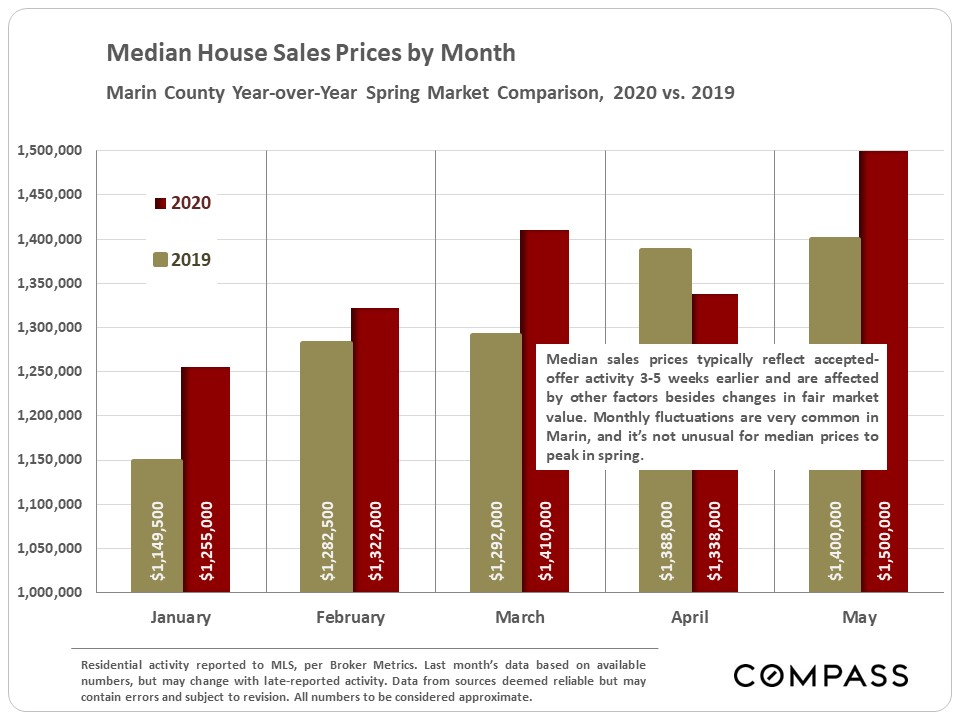
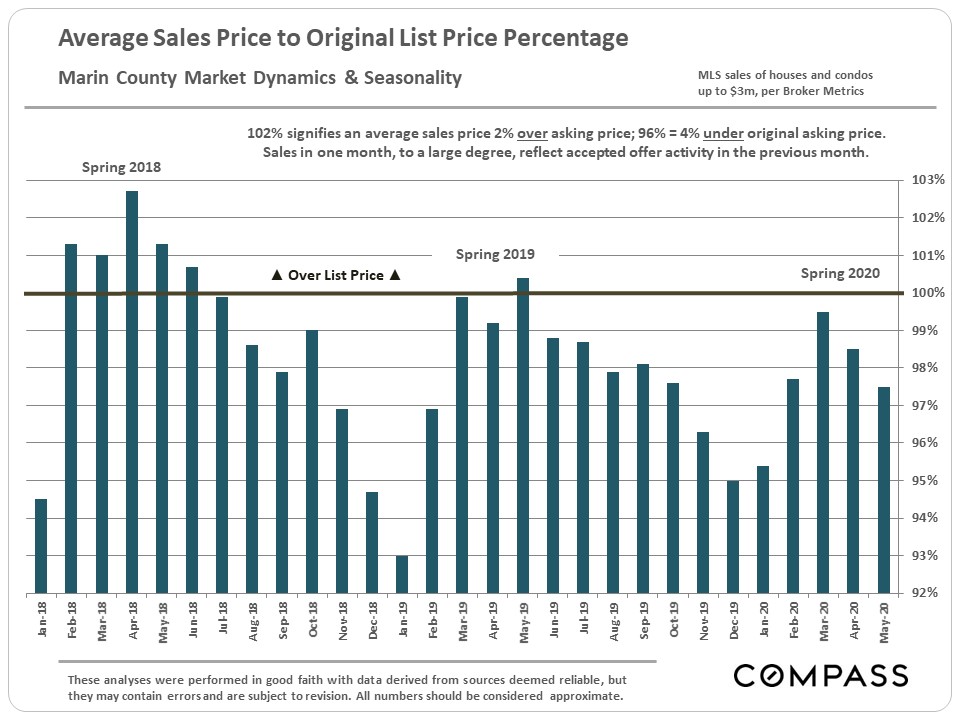
Median House Sales Price Trend |
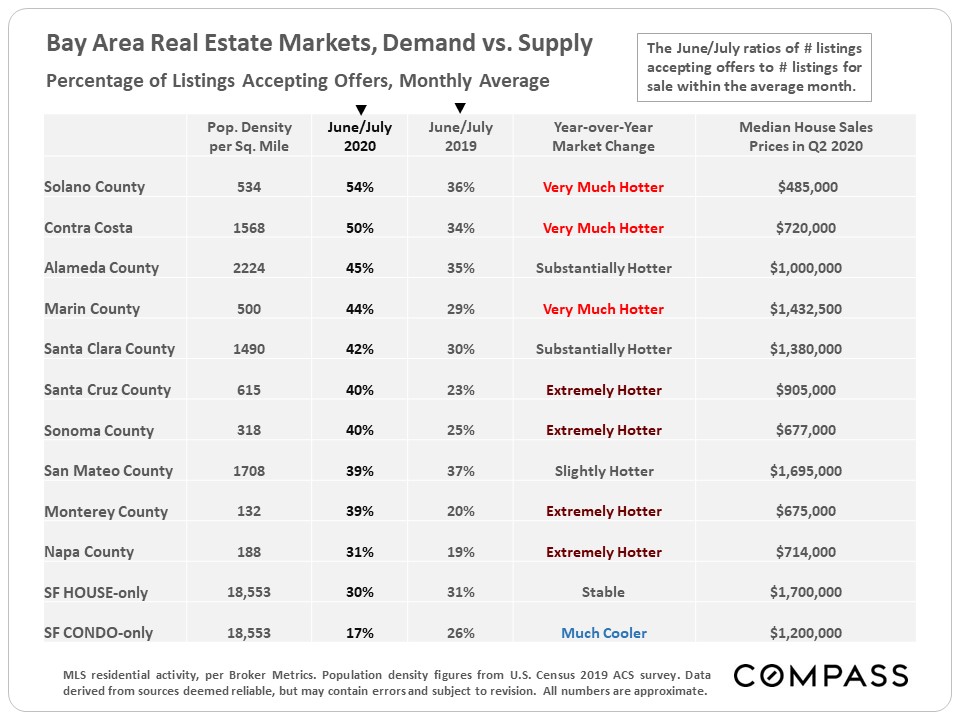
Bay Area Market Comparisons |
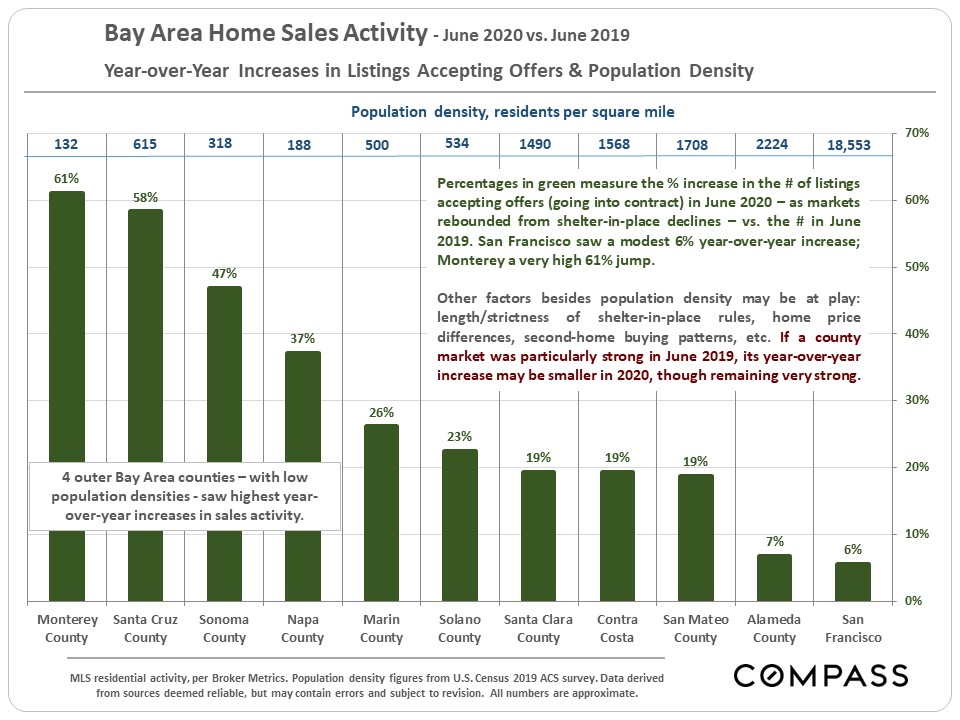
This table ranks each county by the percentage of active listings going into contract in June/July 2020 - a standard statistic of market heat - compares it to the same period of last year, and then rates the year-over-year change. Of the 3 most expensive counties, Marin ranks first in market heat and in year-over-year change. |
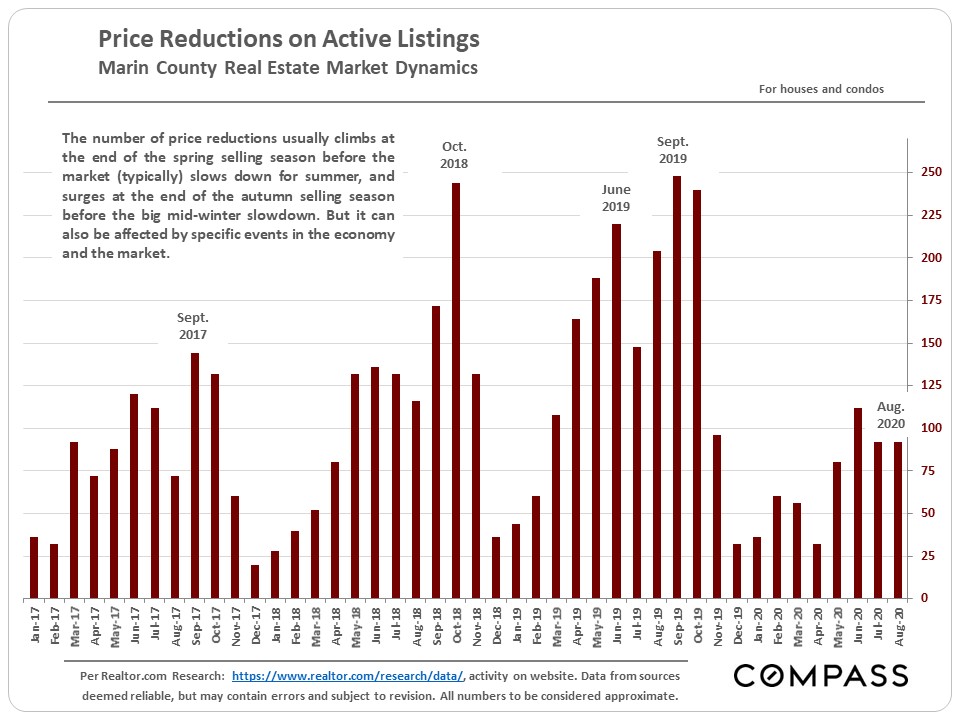
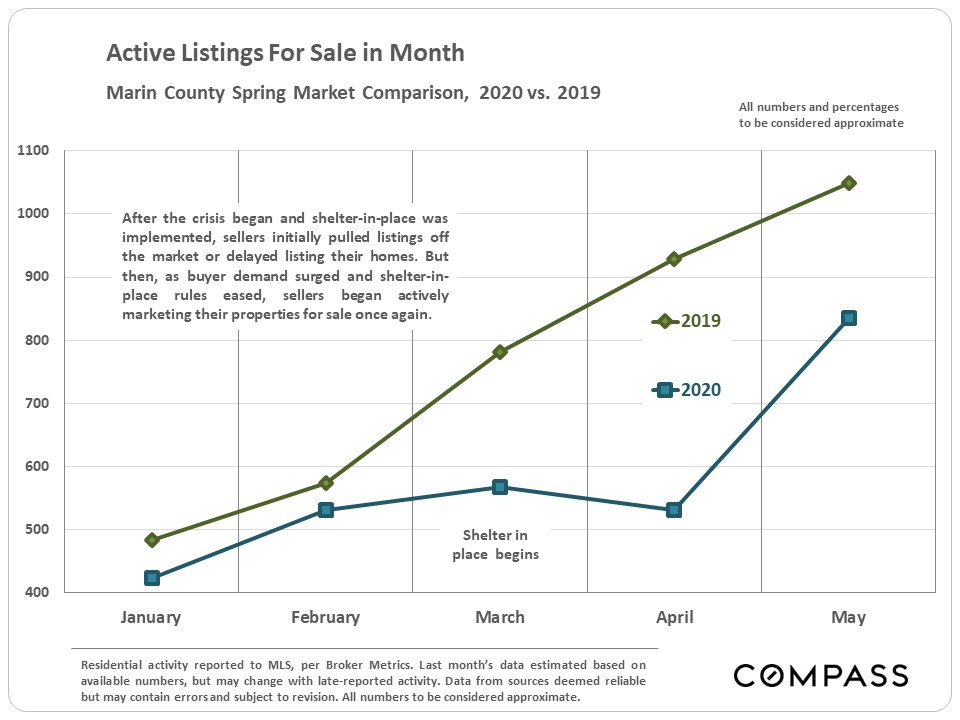
Supply & Demand Active listings, new listings coming on market, listings going into contract and sales volume trends |
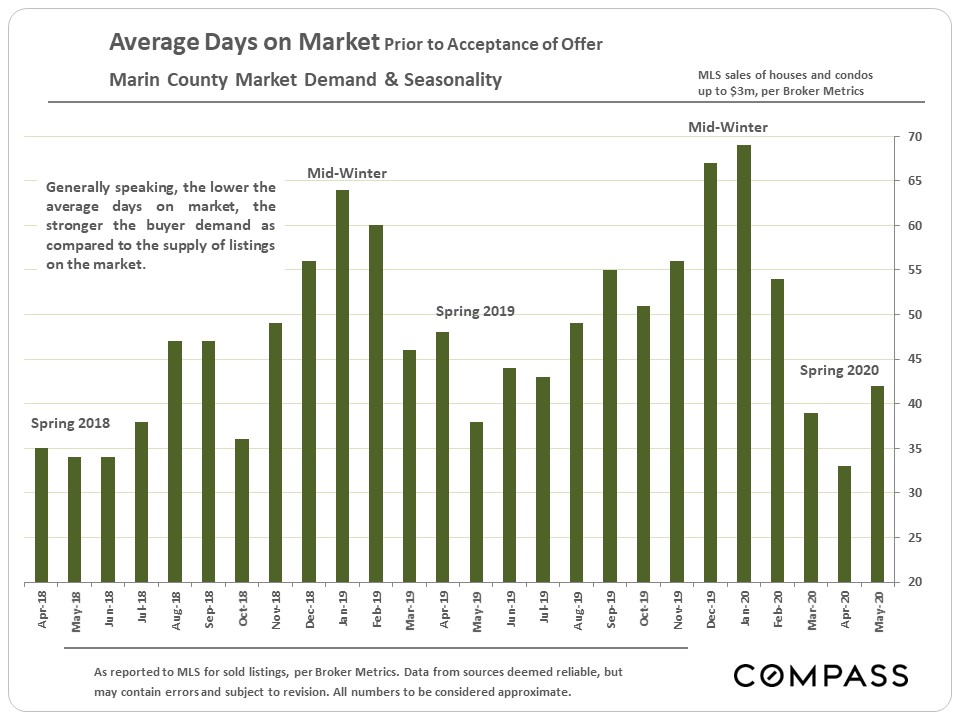
Selected Market Indicators |
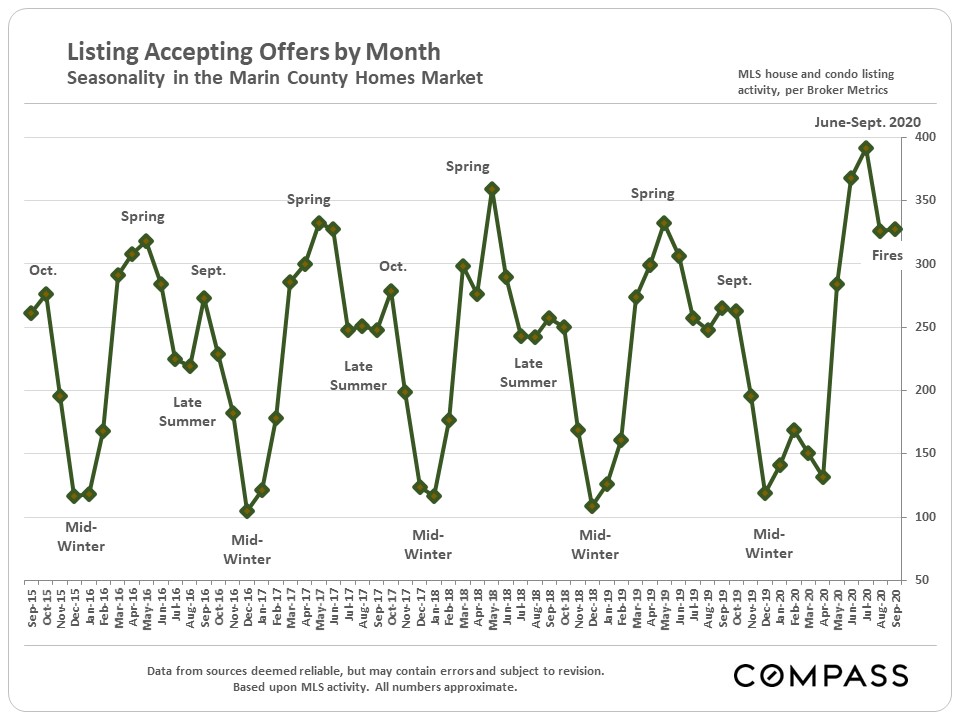
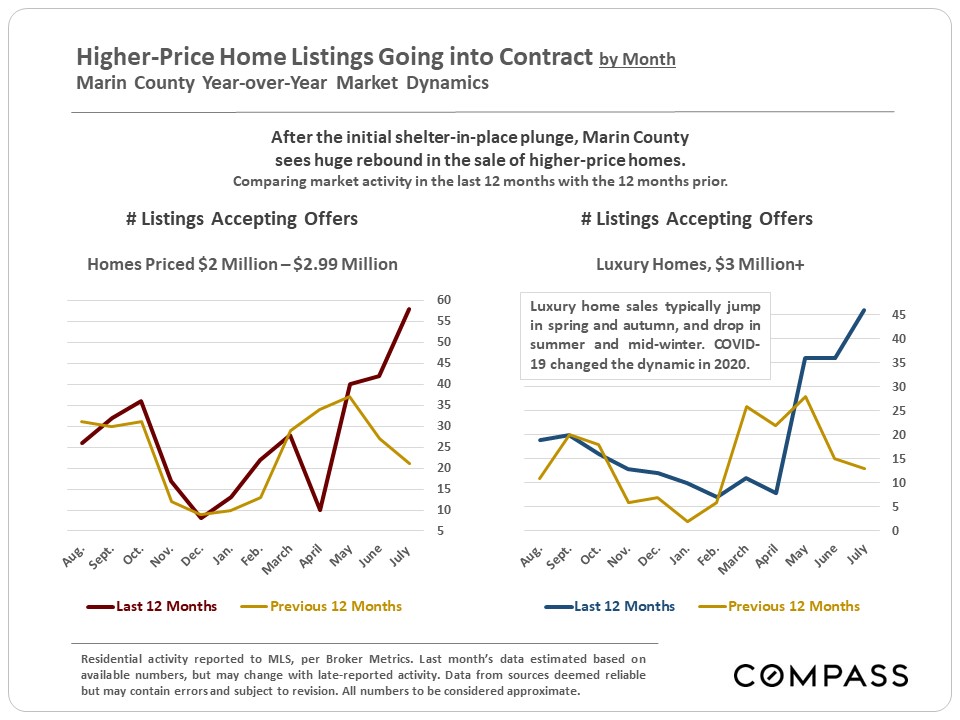
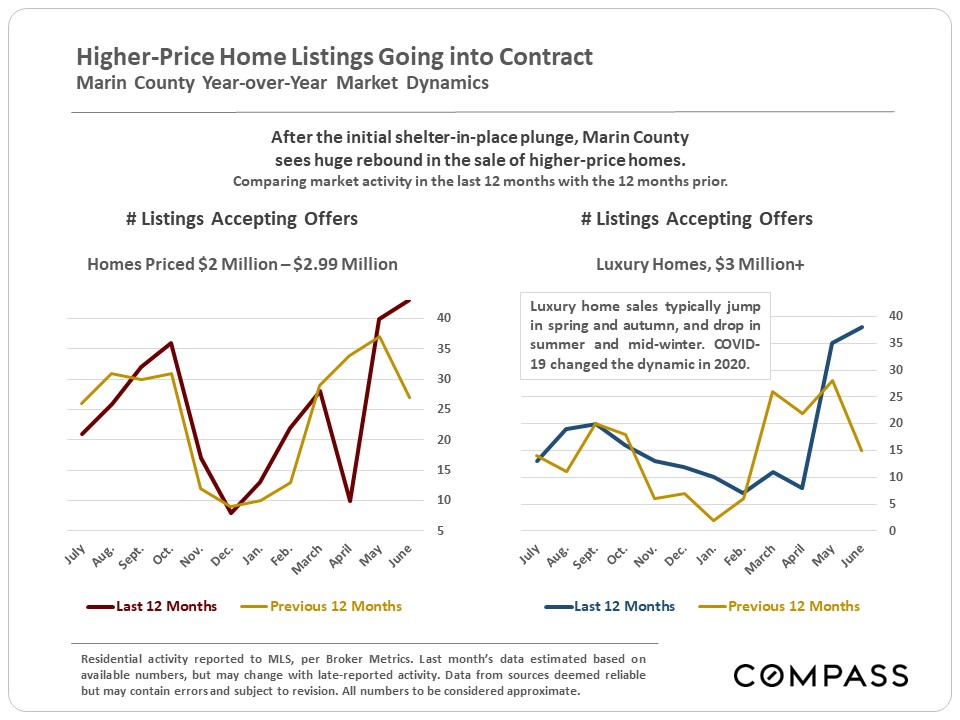
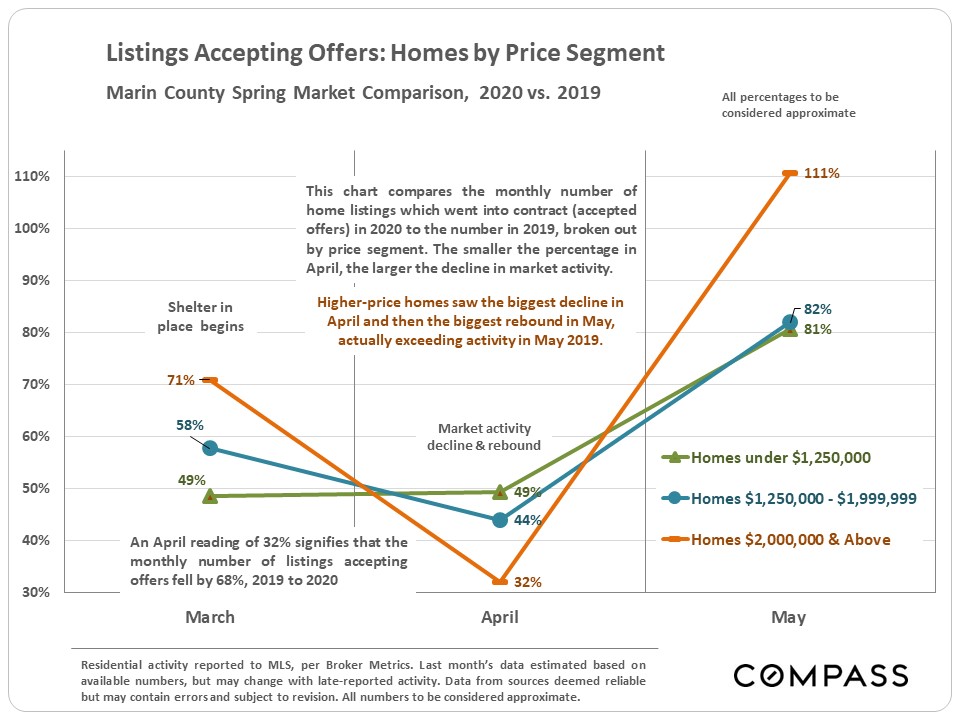
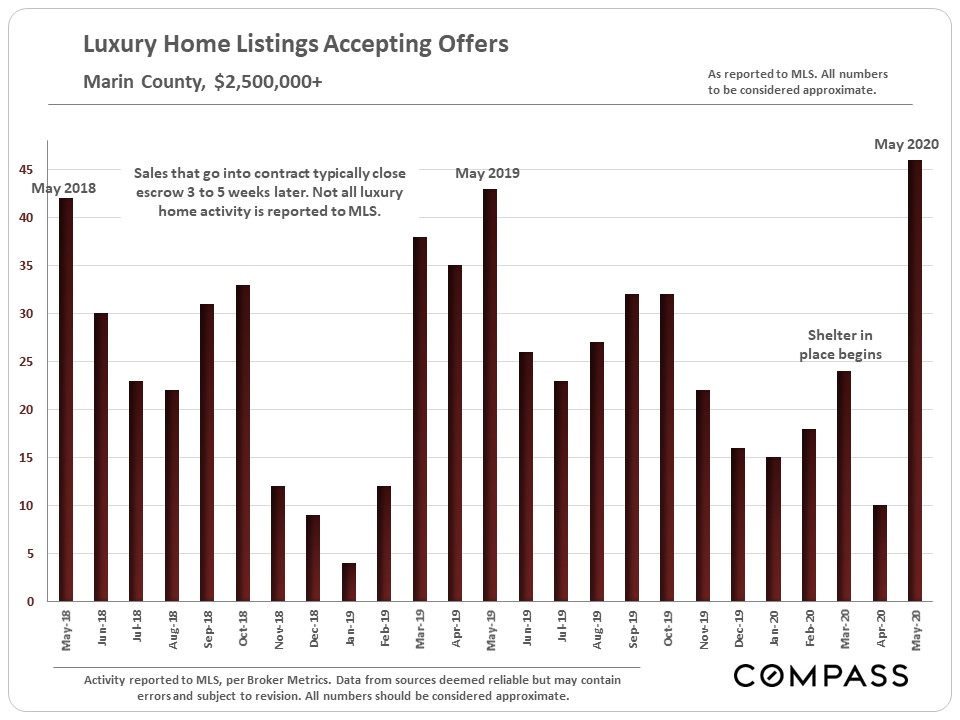
Higher-Price & Luxury Home Listings Accepting Offers |
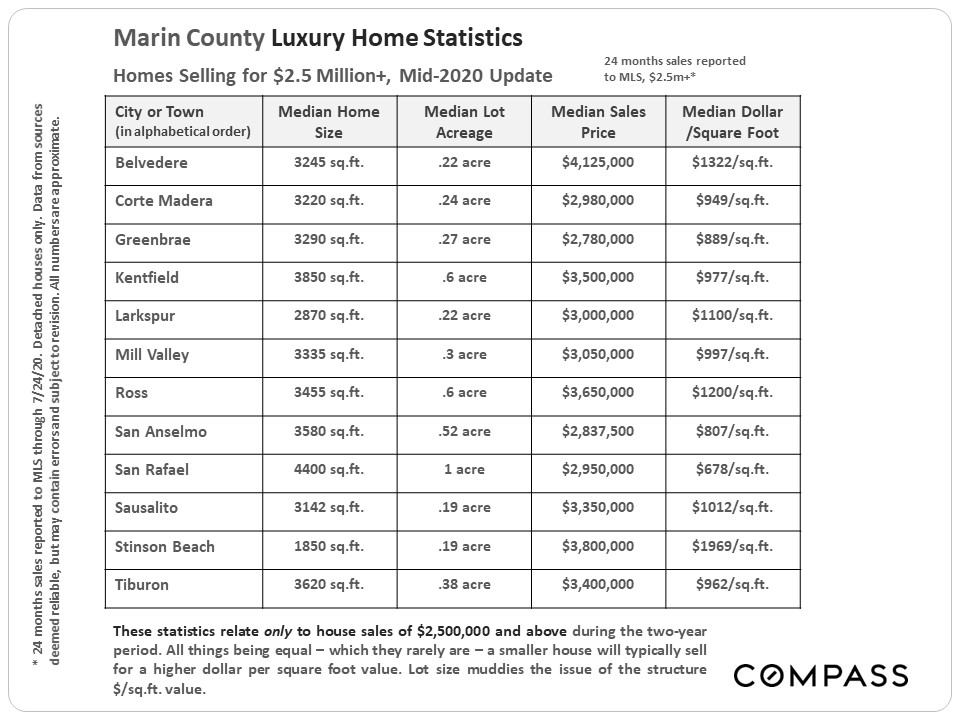
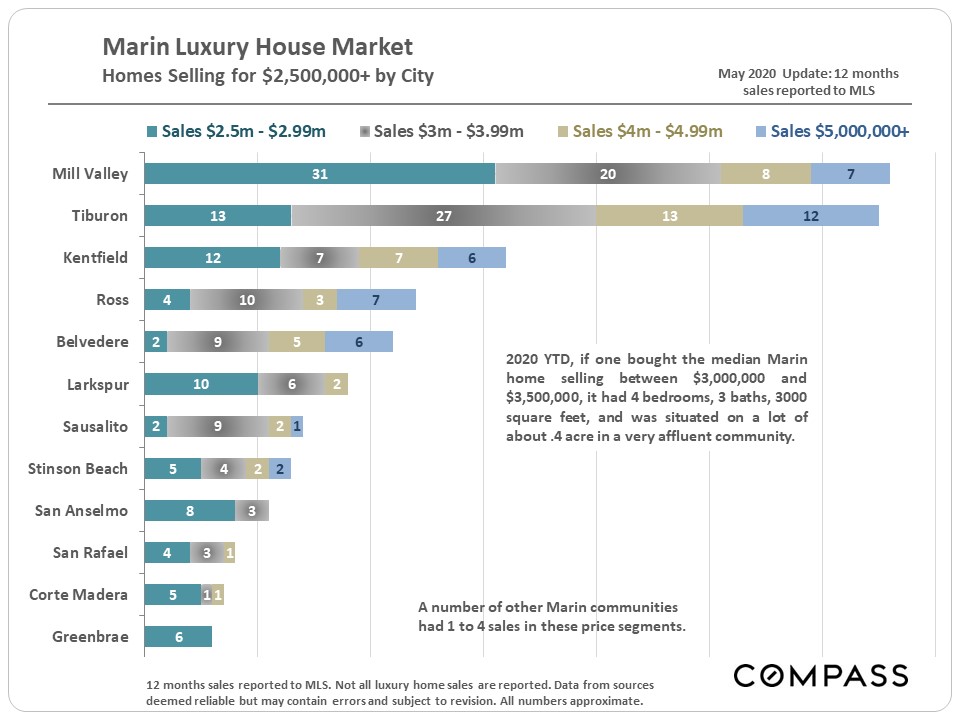
Selected Statistics on Homes Selling for $2.5 Million+ |
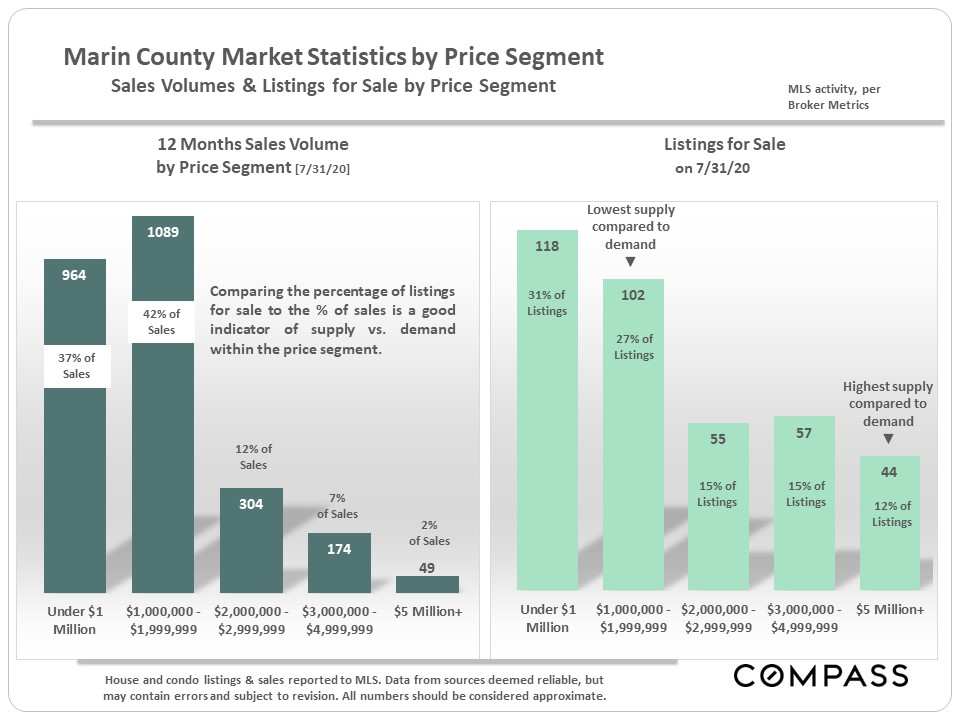
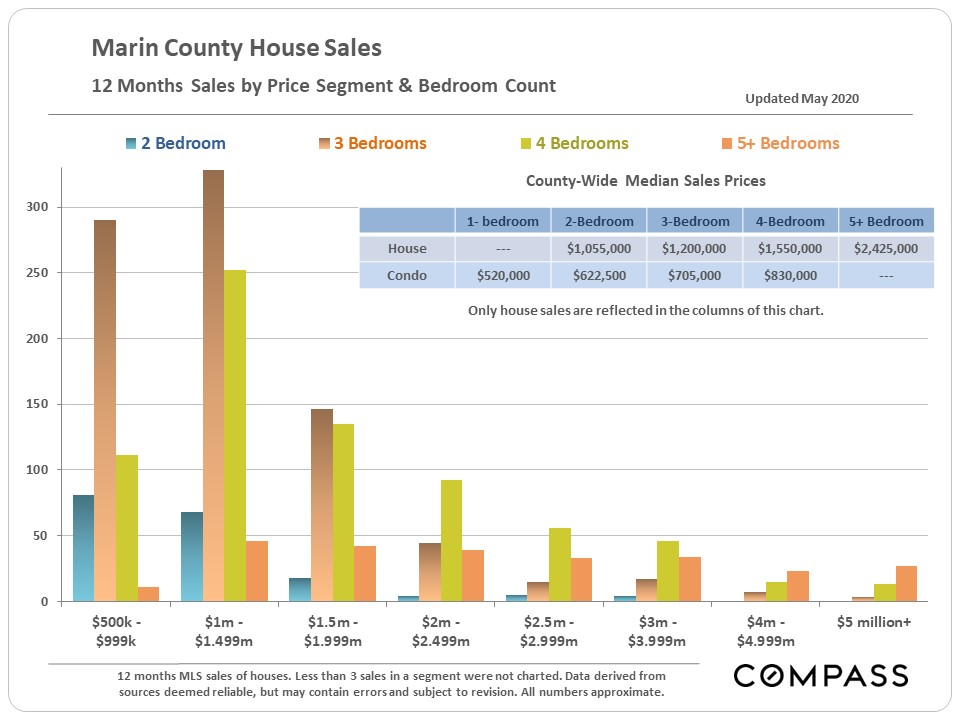
12 Months Sales & Listings for Sale, by Price Segment |
House Sales by Era of Construction |
© Compass 2020 ¦ All Rights Reserved by Compass ¦ Made in NYC Compass is a real estate broker licensed by the State of California operating under multiple entities. License Numbers 01991628, 1527235, 1527365, 1356742, 1443761, 1997075, 1935359, 1961027, 1842987, 1869607, 1866771, 1527205, 1079009, 1272467. All material presented herein is intended for informational purposes only and is compiled from sources deemed reliable but has not been verified. Changes in price, condition, sale or withdrawal may be made without notice. No statement is made as to accuracy of any description. All measurements and square footage are approximate. Equal Housing Opportunity. |
|
|
Marin County Real Estate Market Rebounds Dramatically |
Median House Sales Price Hits New High in Quarter |
|
Supply & demand statistics, median sales price trends, sales and values by city, the luxury home market, and the ongoing effects of COVID-19 |
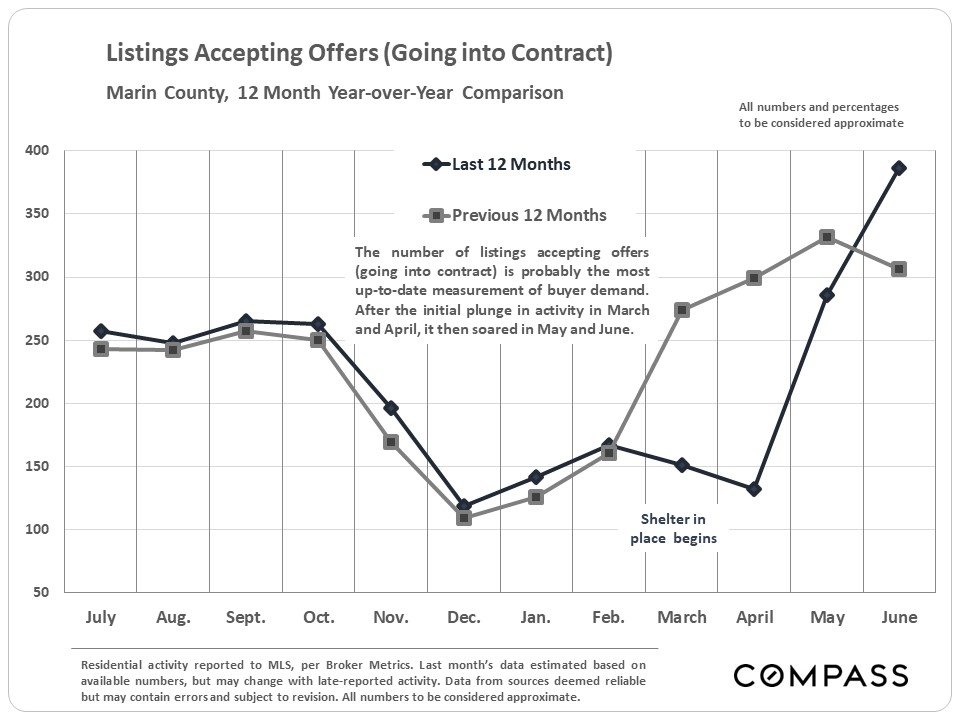
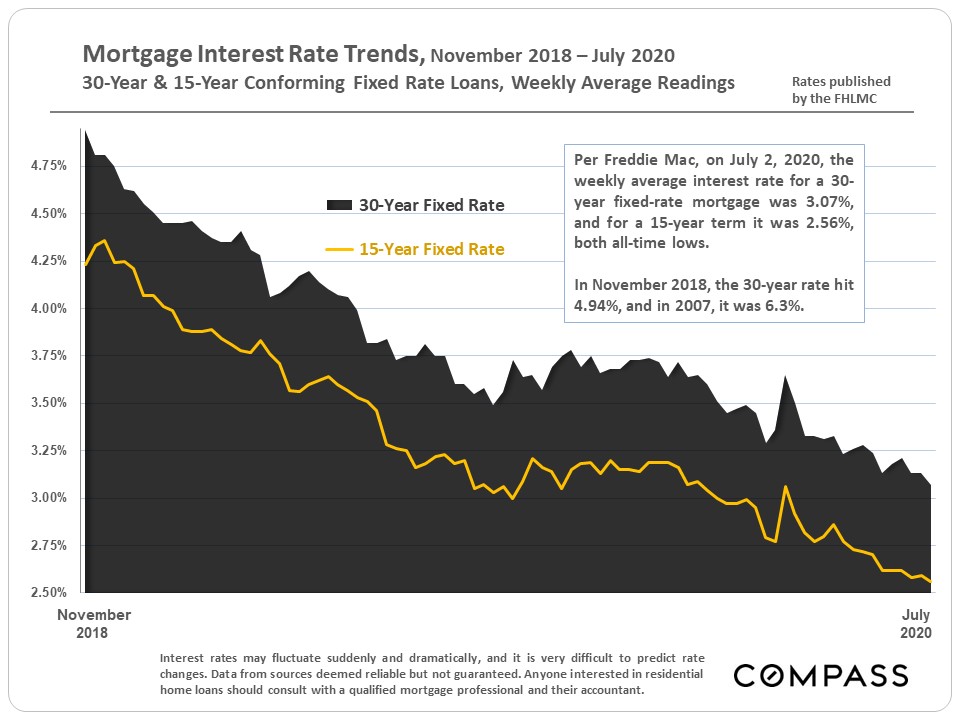
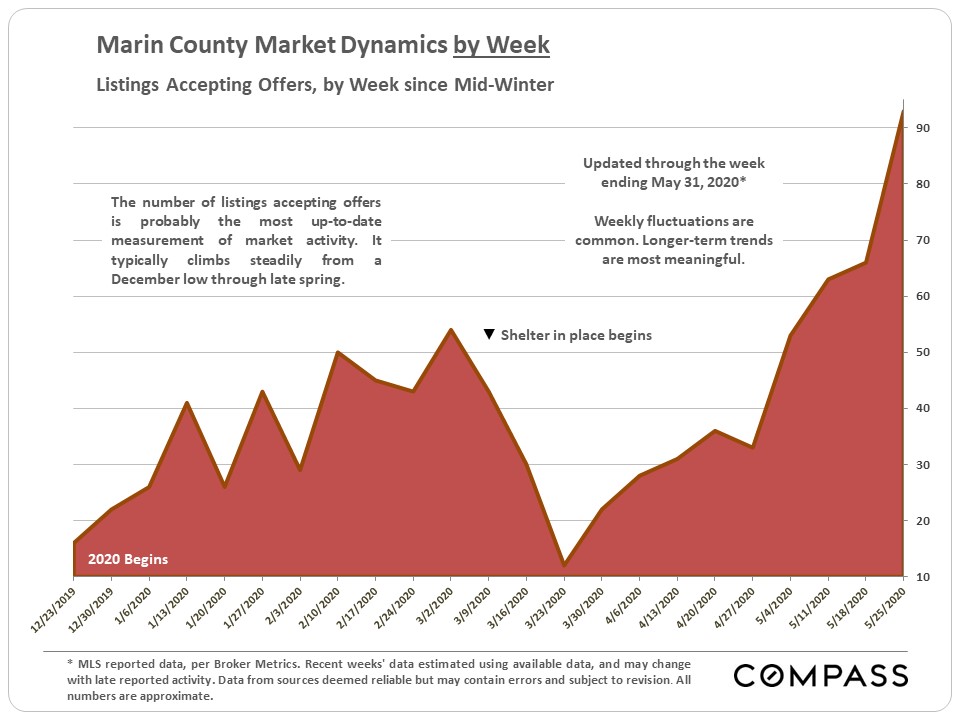
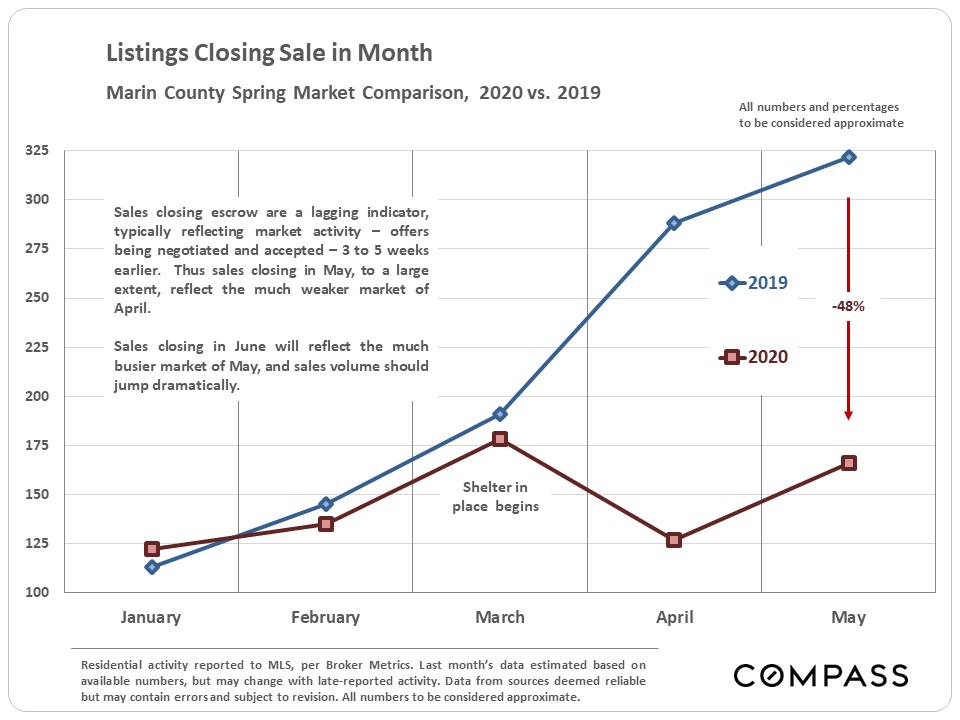
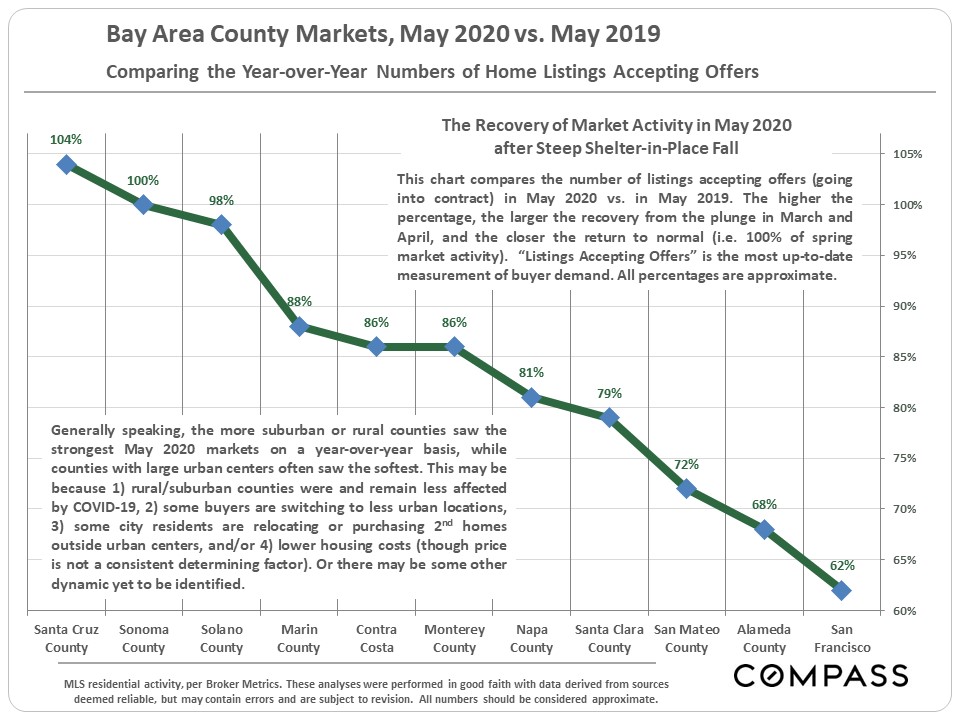
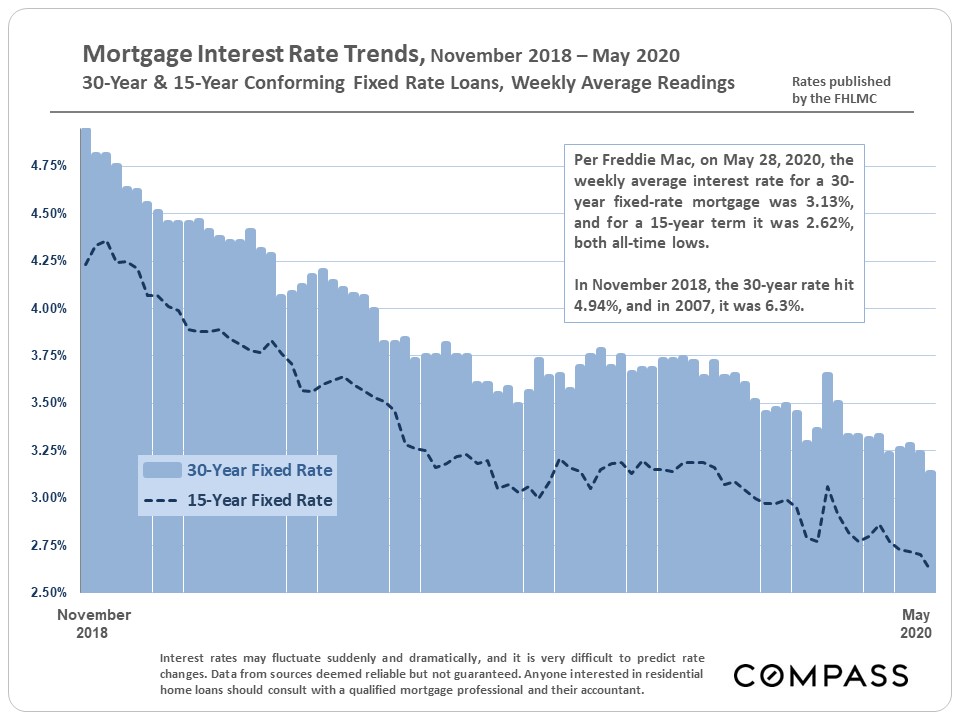
Generally speaking, market activity – as measured by the number of listings going into contract – continued to pick up rapidly in May, bouncing back from the steep plunge following the first shelter in place orders. However, activity in May, which is typically among the busiest selling months of the year, remained below May 2019 (except for the higher price segment, in which activity soared in May). With the easing of shelter in place, as well as the market learning to adjust to new circumstances, it is expected the recovery will continue to increase closer to normal. In fact, based on the strength of buyer demand, some analysts believe the coming months may be busier than in 2019, as sales activity that would have occurred in spring gets pushed into the summer instead. Interest rates hit another historic low at the end of May. Some of the more suburban counties, such as Marin, have been rebounding more quickly than counties with large urban areas (like SF, Oakland, San Jose),which were most impacted by COVID-19. There may be a number of factors at work, which are discussed in a chart within this report. But it is still too soon to reach definitive conclusions about major demographic shifts. Note: Any statistics derived from closed sales – such as median sales prices, sales volume and days on market – reflect the state of the market 3-6 weeks ago when the offers were negotiated and accepted. They are lagging indicators, and May sales data to a large degree reflects the much softer market in April. |
|
It is impossible to know how median and average value statistics apply to any particular home without a specific comparative market analysis. These analyses were made in good faith with data from sources deemed reliable, but may contain errors and are subject to revision. It is not our intent to convince you of a particular position, but to attempt to provide straightforward data and analysis, so you can make your own informed decisions. Median and average statistics are enormous generalities: There are hundreds of different markets in San Francisco and the Bay Area, each with its own unique dynamics. Median prices and average dollar per square foot values can be and often are affected by other factors besides changes in fair market value. Longer term trends are much more meaningful than short-term. Compass is a real estate broker licensed by the State of California, DRE 01527235. Equal Housing Opportunity. This report has been prepared solely for information purposes. The information herein is based on or derived from information generally available to the public and/or from sources believed to be reliable. No representation or warranty can be given with respect to the accuracy or completeness of the information. Compass disclaims any and all liability relating to this report, including without limitation any express or implied representations or warranties for statements contained in, and omissions from, the report. Nothing contained herein is intended to be or should be read as any regulatory, legal, tax, accounting or other advice and Compass does not provide such advice. All opinions are subject to change without notice. Compass makes no representation regarding the accuracy of any statements regarding any references to the laws, statutes or regulations of any state are those of the author(s). Past performance is no guarantee of future results.